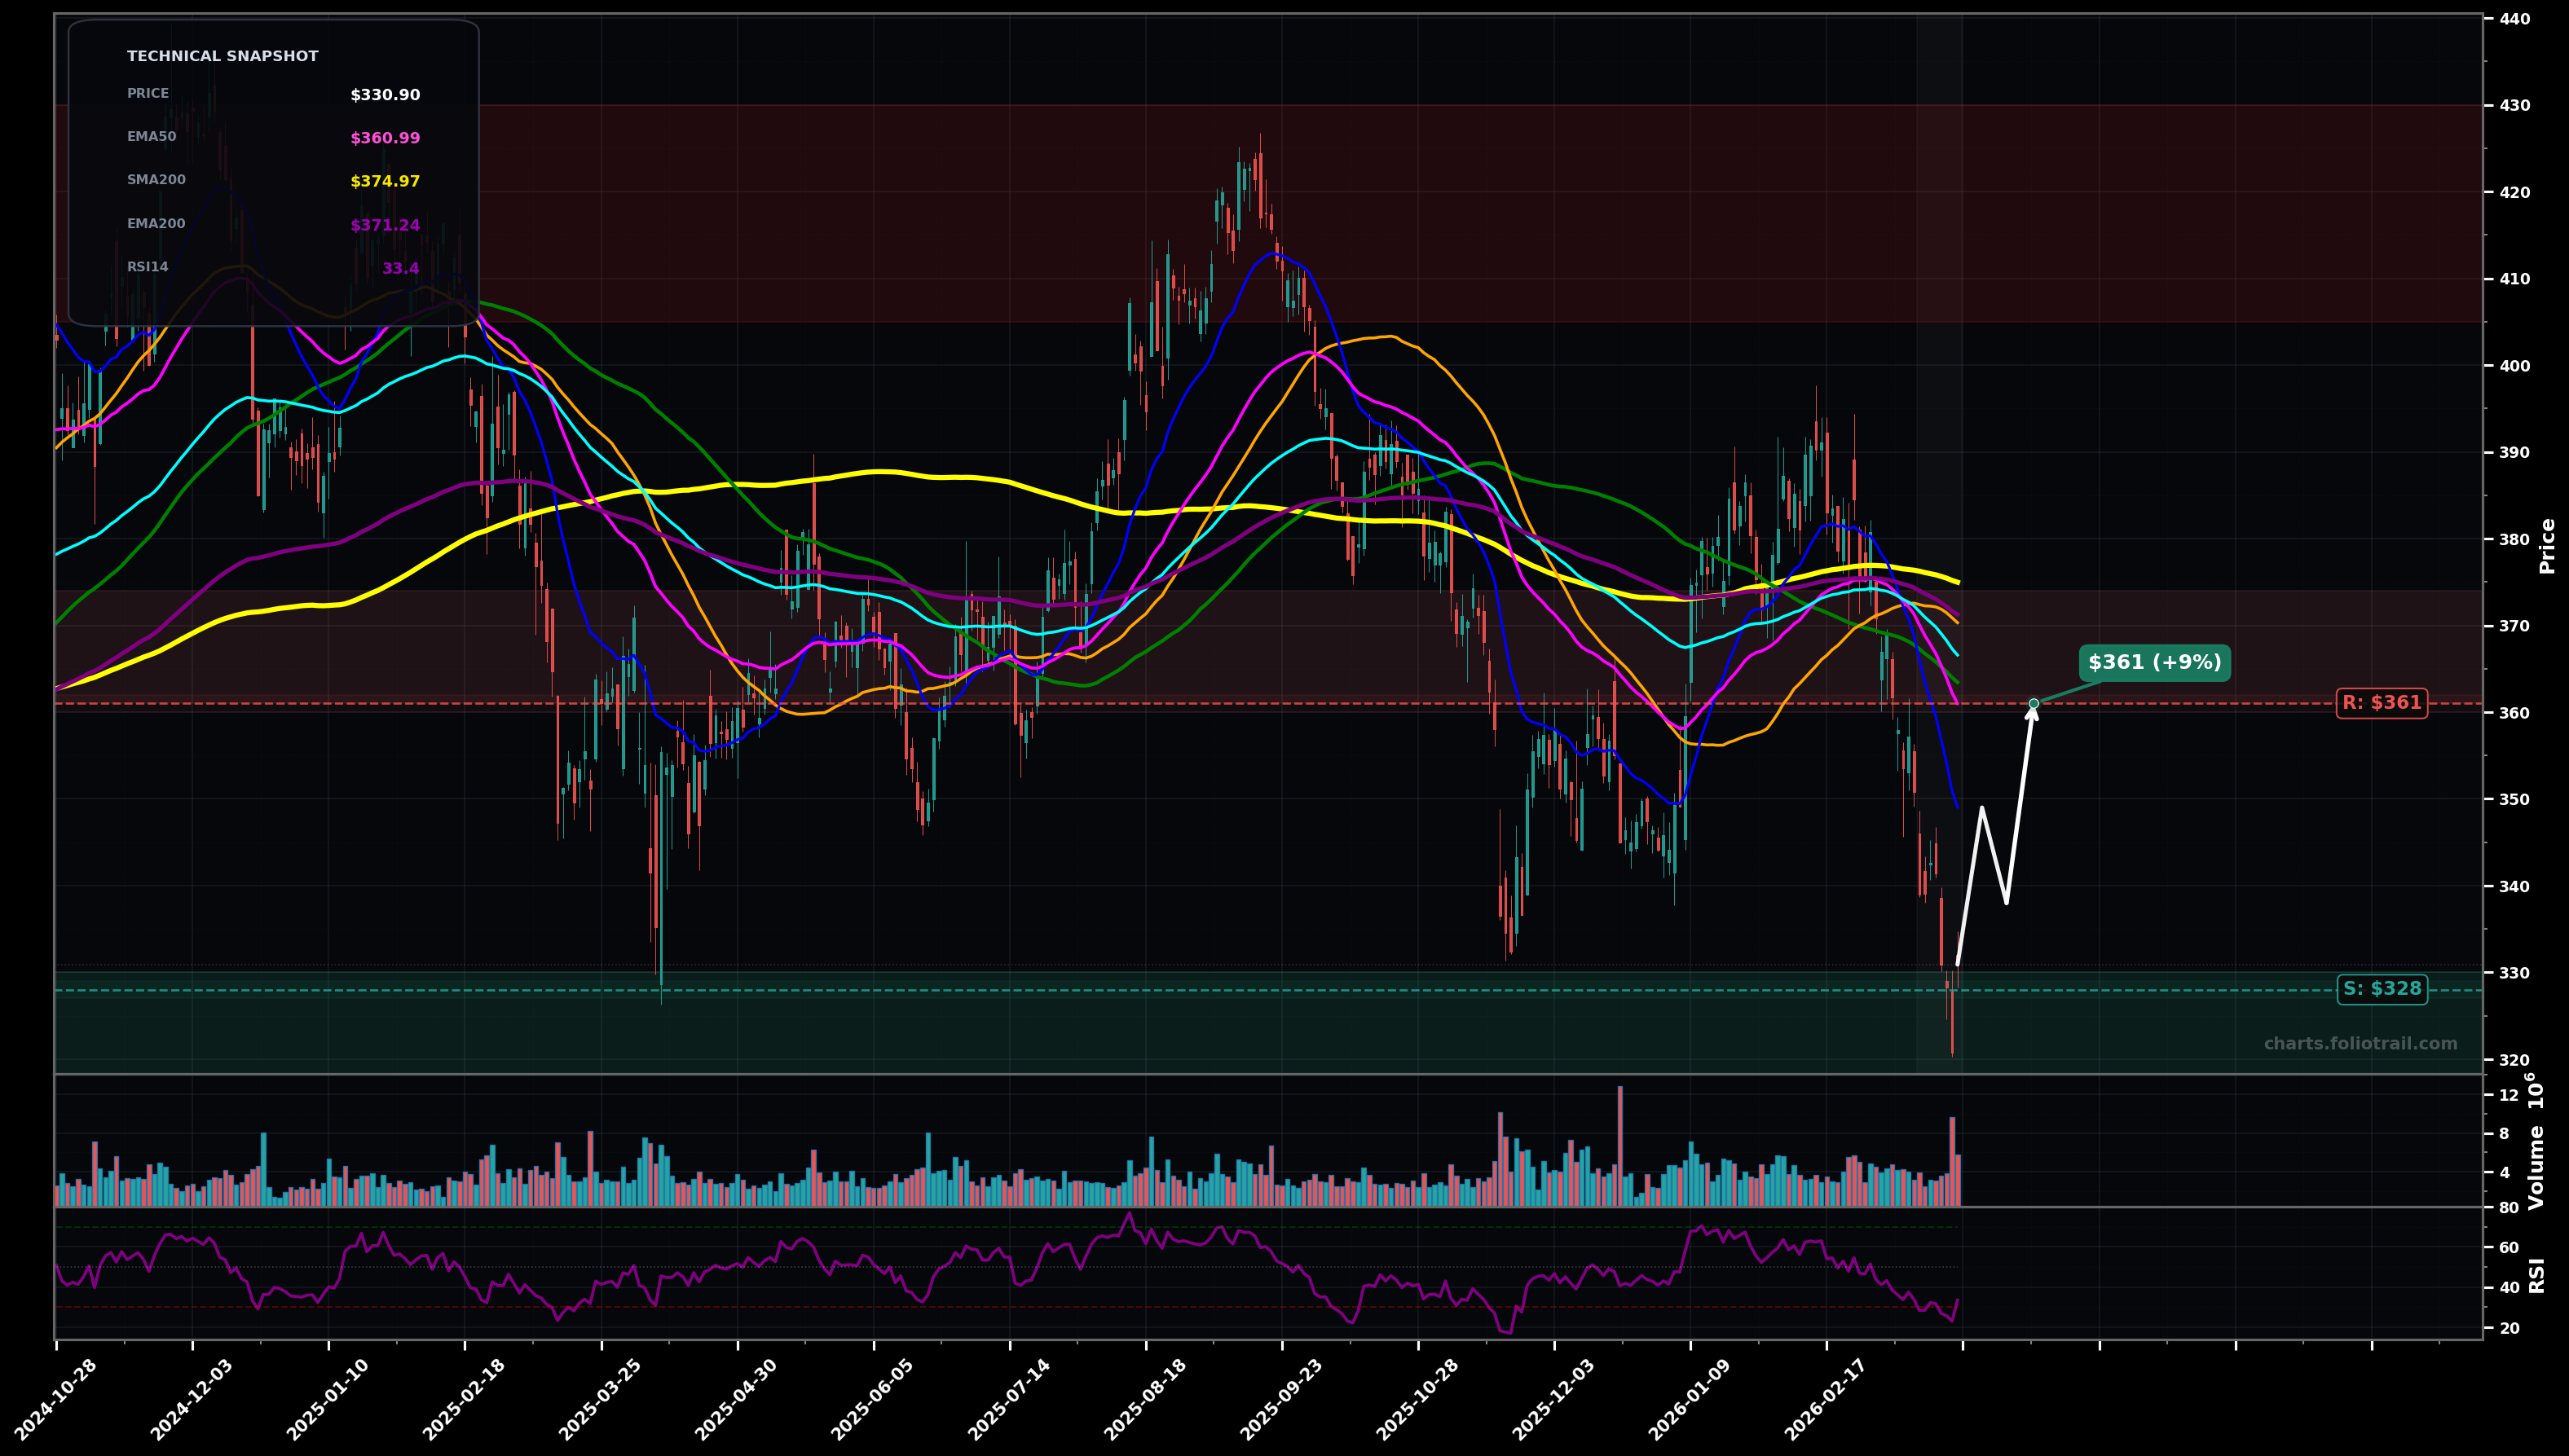
As of March 24, 2026, HD (The Home Depot, Inc.) is in a falling knife state on the daily chart, with a confidence level of 74%. Key support is at $328 and key resistance at $361. Sharp selloff to ~$330 with consecutive red candles, expanding volume, and price now well below EMA50/EMA100 and all key SMAs; RSI ~33 (near oversold).
Dead-cat bounce / oversold relief rally from the $328-$332 swing-support zone (wave (v) capitulation likely finishing), then rejection near the falling EMA50/previous breakdown area; base-building attempt only if price holds above the prior swing low.
Continuation flush: breakdown extends below the recent swing-low reference (~$330 area) toward the next demand pocket; this fits an Elliott wave extension where wave (v) stretches and only later forms a higher low.
Daily close below $328 would confirm continued FALLING_KNIFE pressure
Two daily closes back above $361 (EMA50 zone) would invalidate FALLING_KNIFE and shift toward a bottoming/bounce regime
Buy zones mapped to breakdown continuation support pockets + typical fib extension area after a strong impulse down; size in only after a daily hold/reversal candle to avoid catching the knife.
Trim into mean-reversion/MA confluence (EMA50/EMA100 then SMA100/200 clusters) and close into prior swing-supply near the $405-$430 region where rallies previously failed.
As of March 24, 2026, HD (The Home Depot, Inc.) is in a falling knife state on the daily chart with 74% confidence. Sharp selloff to ~$330 with consecutive red candles, expanding volume, and price now well below EMA50/EMA100 and all key SMAs; RSI ~33 (near oversold).
On the daily timeframe, HD has key support at $328 and key resistance at $361. The most likely scenario (bullish) targets $349 and $361, with a revert level at $338.
HD (The Home Depot, Inc.) is currently classified as falling knife on the daily chart, with 74% confidence. Confirmation requires: Daily close below $328 would confirm continued FALLING_KNIFE pressure This would be invalidated by: Two daily closes back above $361 (EMA50 zone) would invalidate FALLING_KNIFE and shift toward a bottoming/bounce regime
The most likely scenario (bullish) targets $349 and $361, with a revert level at $338. The alternative scenario (bearish) targets $318 and $305.
All content on this website — including charts, analysis, price targets, support/resistance levels, and position zones — is generated entirely by AI and provided for educational and informational purposes only.
This is not financial advice. NEXUSNOIR VENTURES SL (the operator of this website) is not a registered investment adviser or broker-dealer. You should not make investment decisions based solely on this information. Always do your own research and consult a qualified financial advisor.
By continuing, you acknowledge that you have read and agree to our full disclaimer & terms of use and privacy policy.