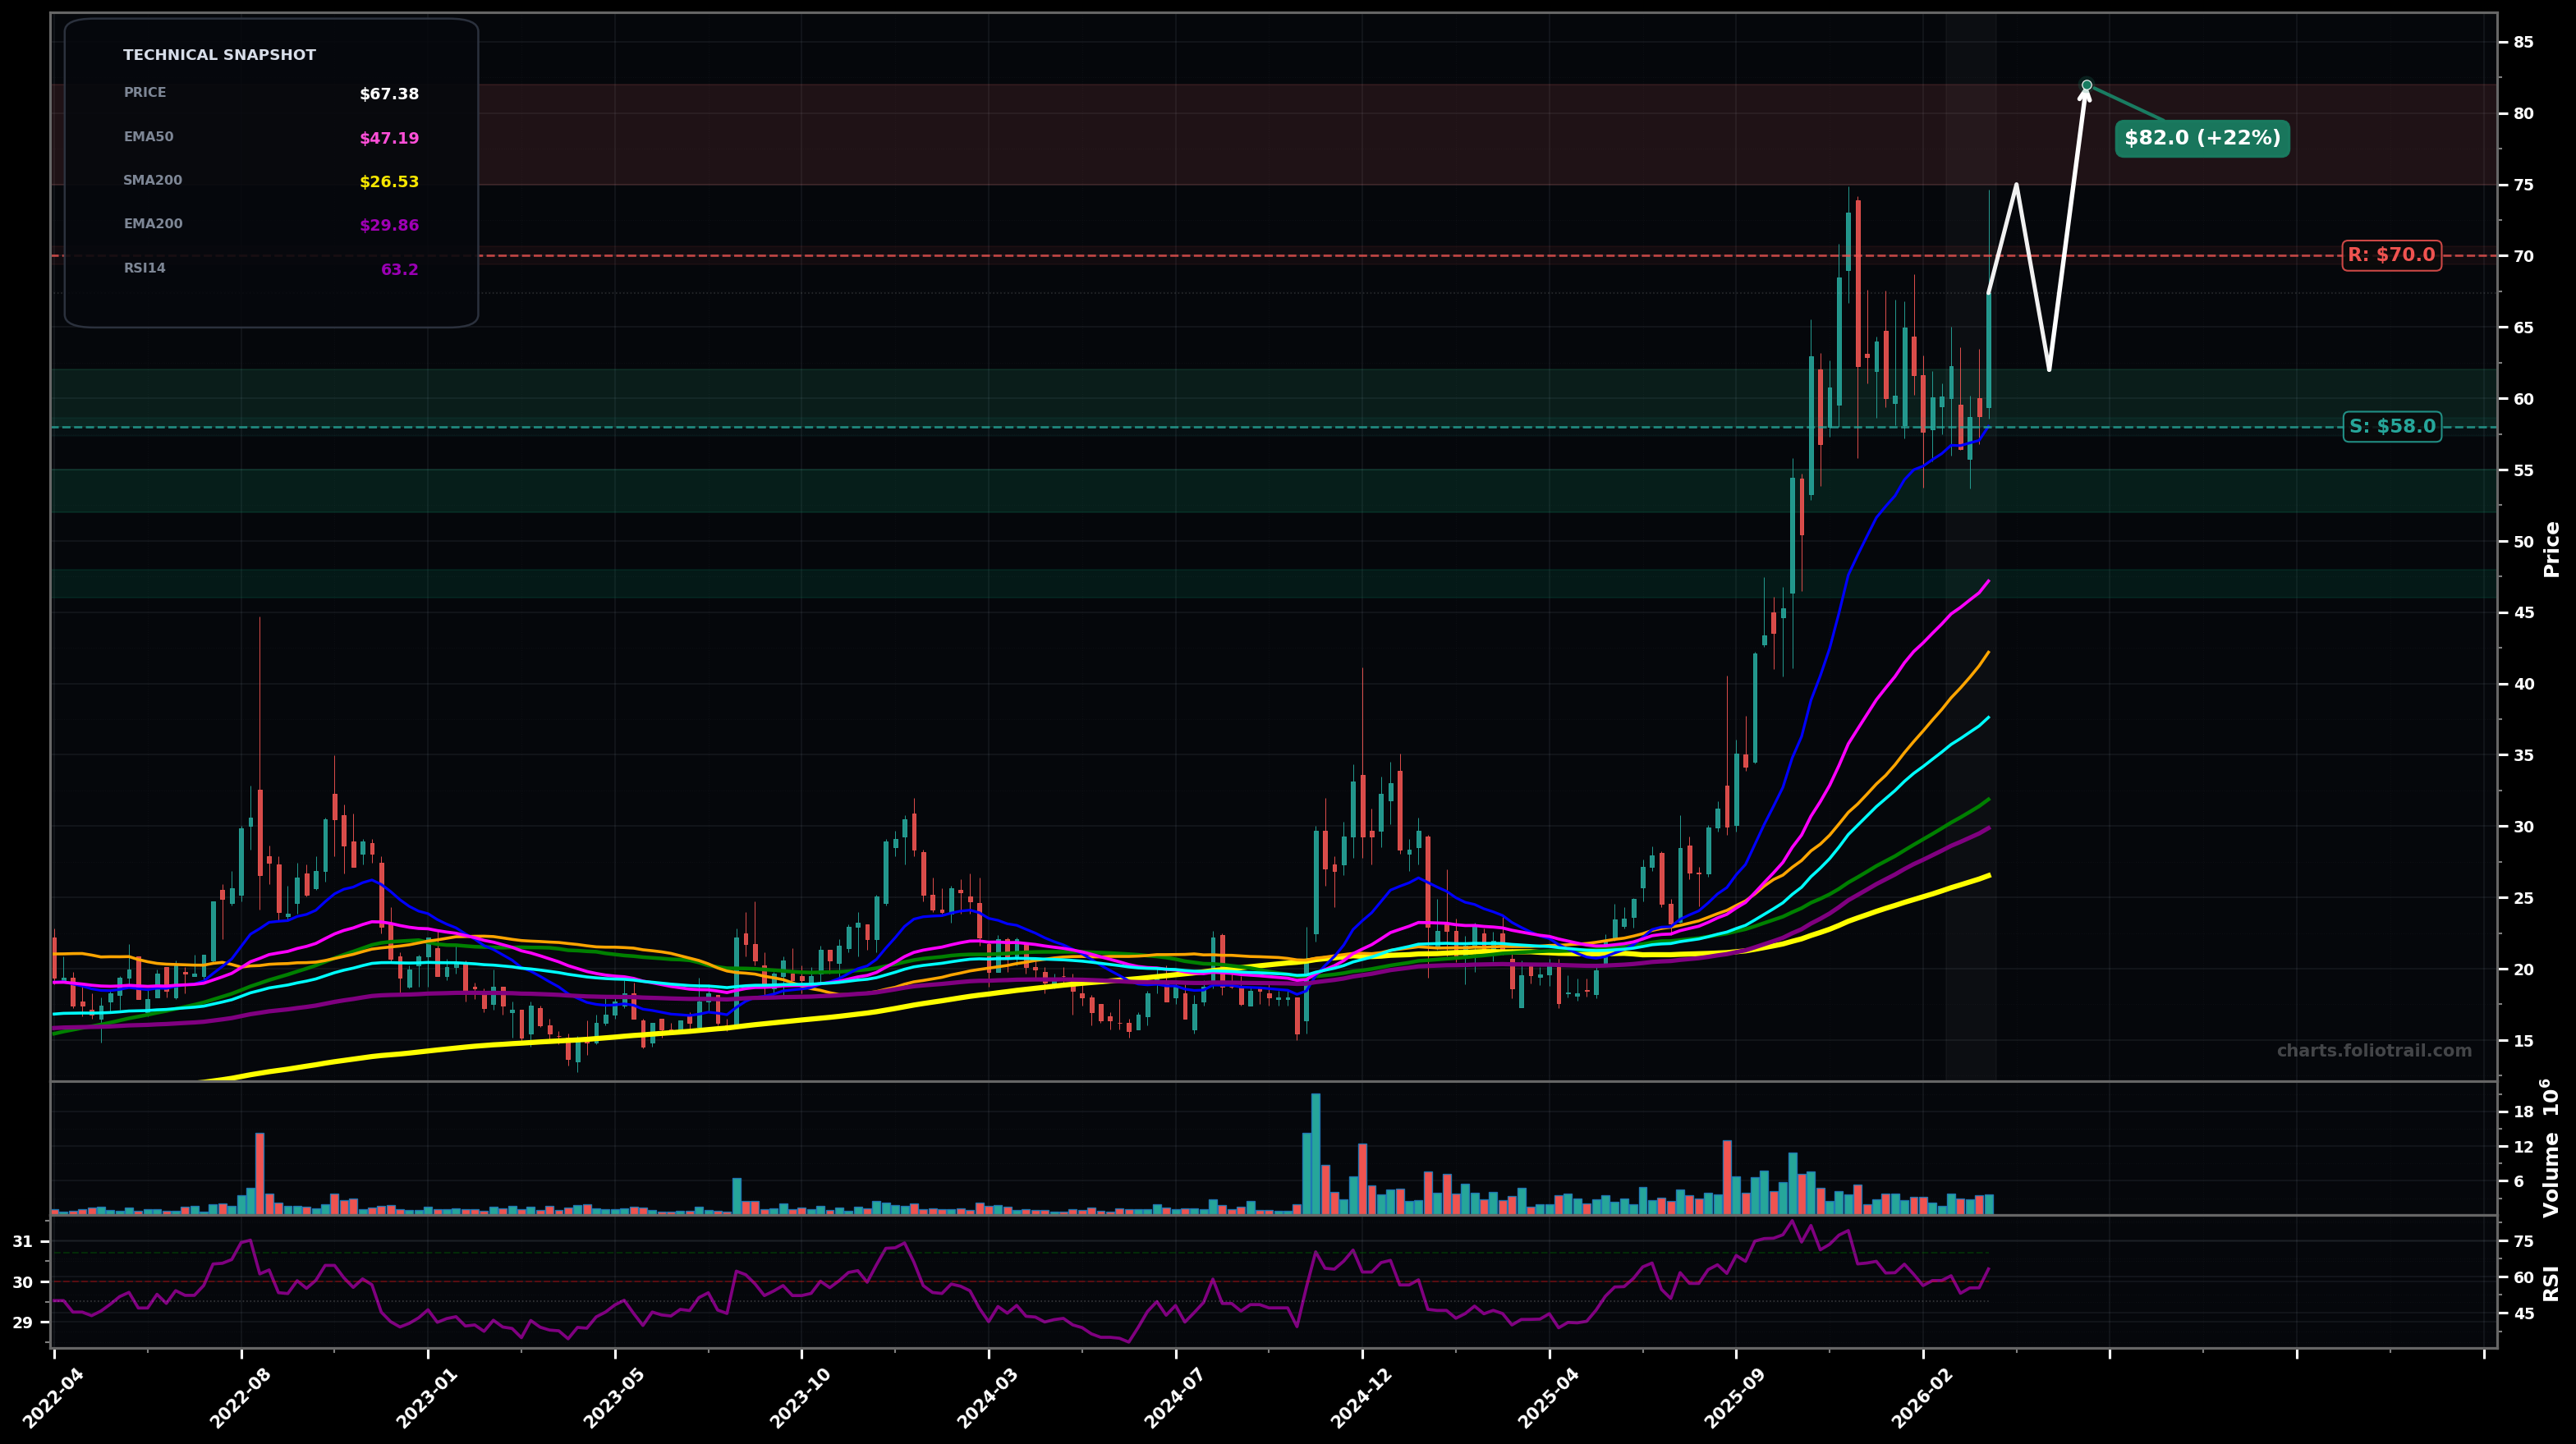
As of March 26, 2026, GSAT (Globalstar, Inc.) is in a uptrend state on the weekly chart, with a confidence level of 74%. Key support is at $58.0 and key resistance at $70.0. Weekly uptrend resumed; strong impulsive push from ~$58 area to ~$67.38 after a multi-week consolidation under prior highs (~$70+).
Bullish continuation: price consolidates briefly above ~$60, then breaks through the ~$70 supply zone (prior peak) to test higher fib extensions.
Bearish pullback within uptrend: rejection near ~$70 leads to a deeper retrace toward the rising EMA20/EMA50 area, then attempt to base and re-break.
Weekly close above $70.00 (prior supply zone) with follow-through the next week
Weekly close below $58.00 (loss of recent breakout/pivot support)
Buy-the-dip zones align with prior breakout retest (~$58-62), then deeper fib/structure support (~$52-55), with heavy add at EMA50 (~$47) where trend must hold to stay healthy.
Trim into strength at prior-high breakout extension ($75-82), trim more if extension becomes euphoric ($88-98), and consider full exit only on extreme multi-year stretch ($105-120) relative to long MAs and likely fib extensions.
As of March 26, 2026, GSAT (Globalstar, Inc.) is in a uptrend state on the weekly chart with 74% confidence. Weekly uptrend resumed; strong impulsive push from ~$58 area to ~$67.38 after a multi-week consolidation under prior highs (~$70+).
On the weekly timeframe, GSAT has key support at $58.0 and key resistance at $70.0. The most likely scenario (bullish) targets $75.0 and $82.0, with a revert level at $62.0.
GSAT (Globalstar, Inc.) is currently classified as uptrend on the weekly chart, with 74% confidence. Confirmation requires: Weekly close above $70.00 (prior supply zone) with follow-through the next week This would be invalidated by: Weekly close below $58.00 (loss of recent breakout/pivot support)
The most likely scenario (bullish) targets $75.0 and $82.0, with a revert level at $62.0. The alternative scenario (bearish) targets $55.0 and $47.0.
Multi-layer AI agents analyse 200+ stocks across daily, weekly, and monthly timeframes — producing market state classifications, price scenarios with targets, and position entry/exit levels. Updated every trading day after market close. No paywall. No sign-up required.
Built by Foliotrail.
All content on this website — including charts, analysis, price targets, support/resistance levels, and position zones — is generated entirely by AI and provided for educational and informational purposes only.
This is not financial advice. NEXUSNOIR VENTURES SL (the operator of this website) is not a registered investment adviser or broker-dealer. You should not make investment decisions based solely on this information. Always do your own research and consult a qualified financial advisor.
By continuing, you acknowledge that you have read and agree to our full disclaimer & terms of use and privacy policy.