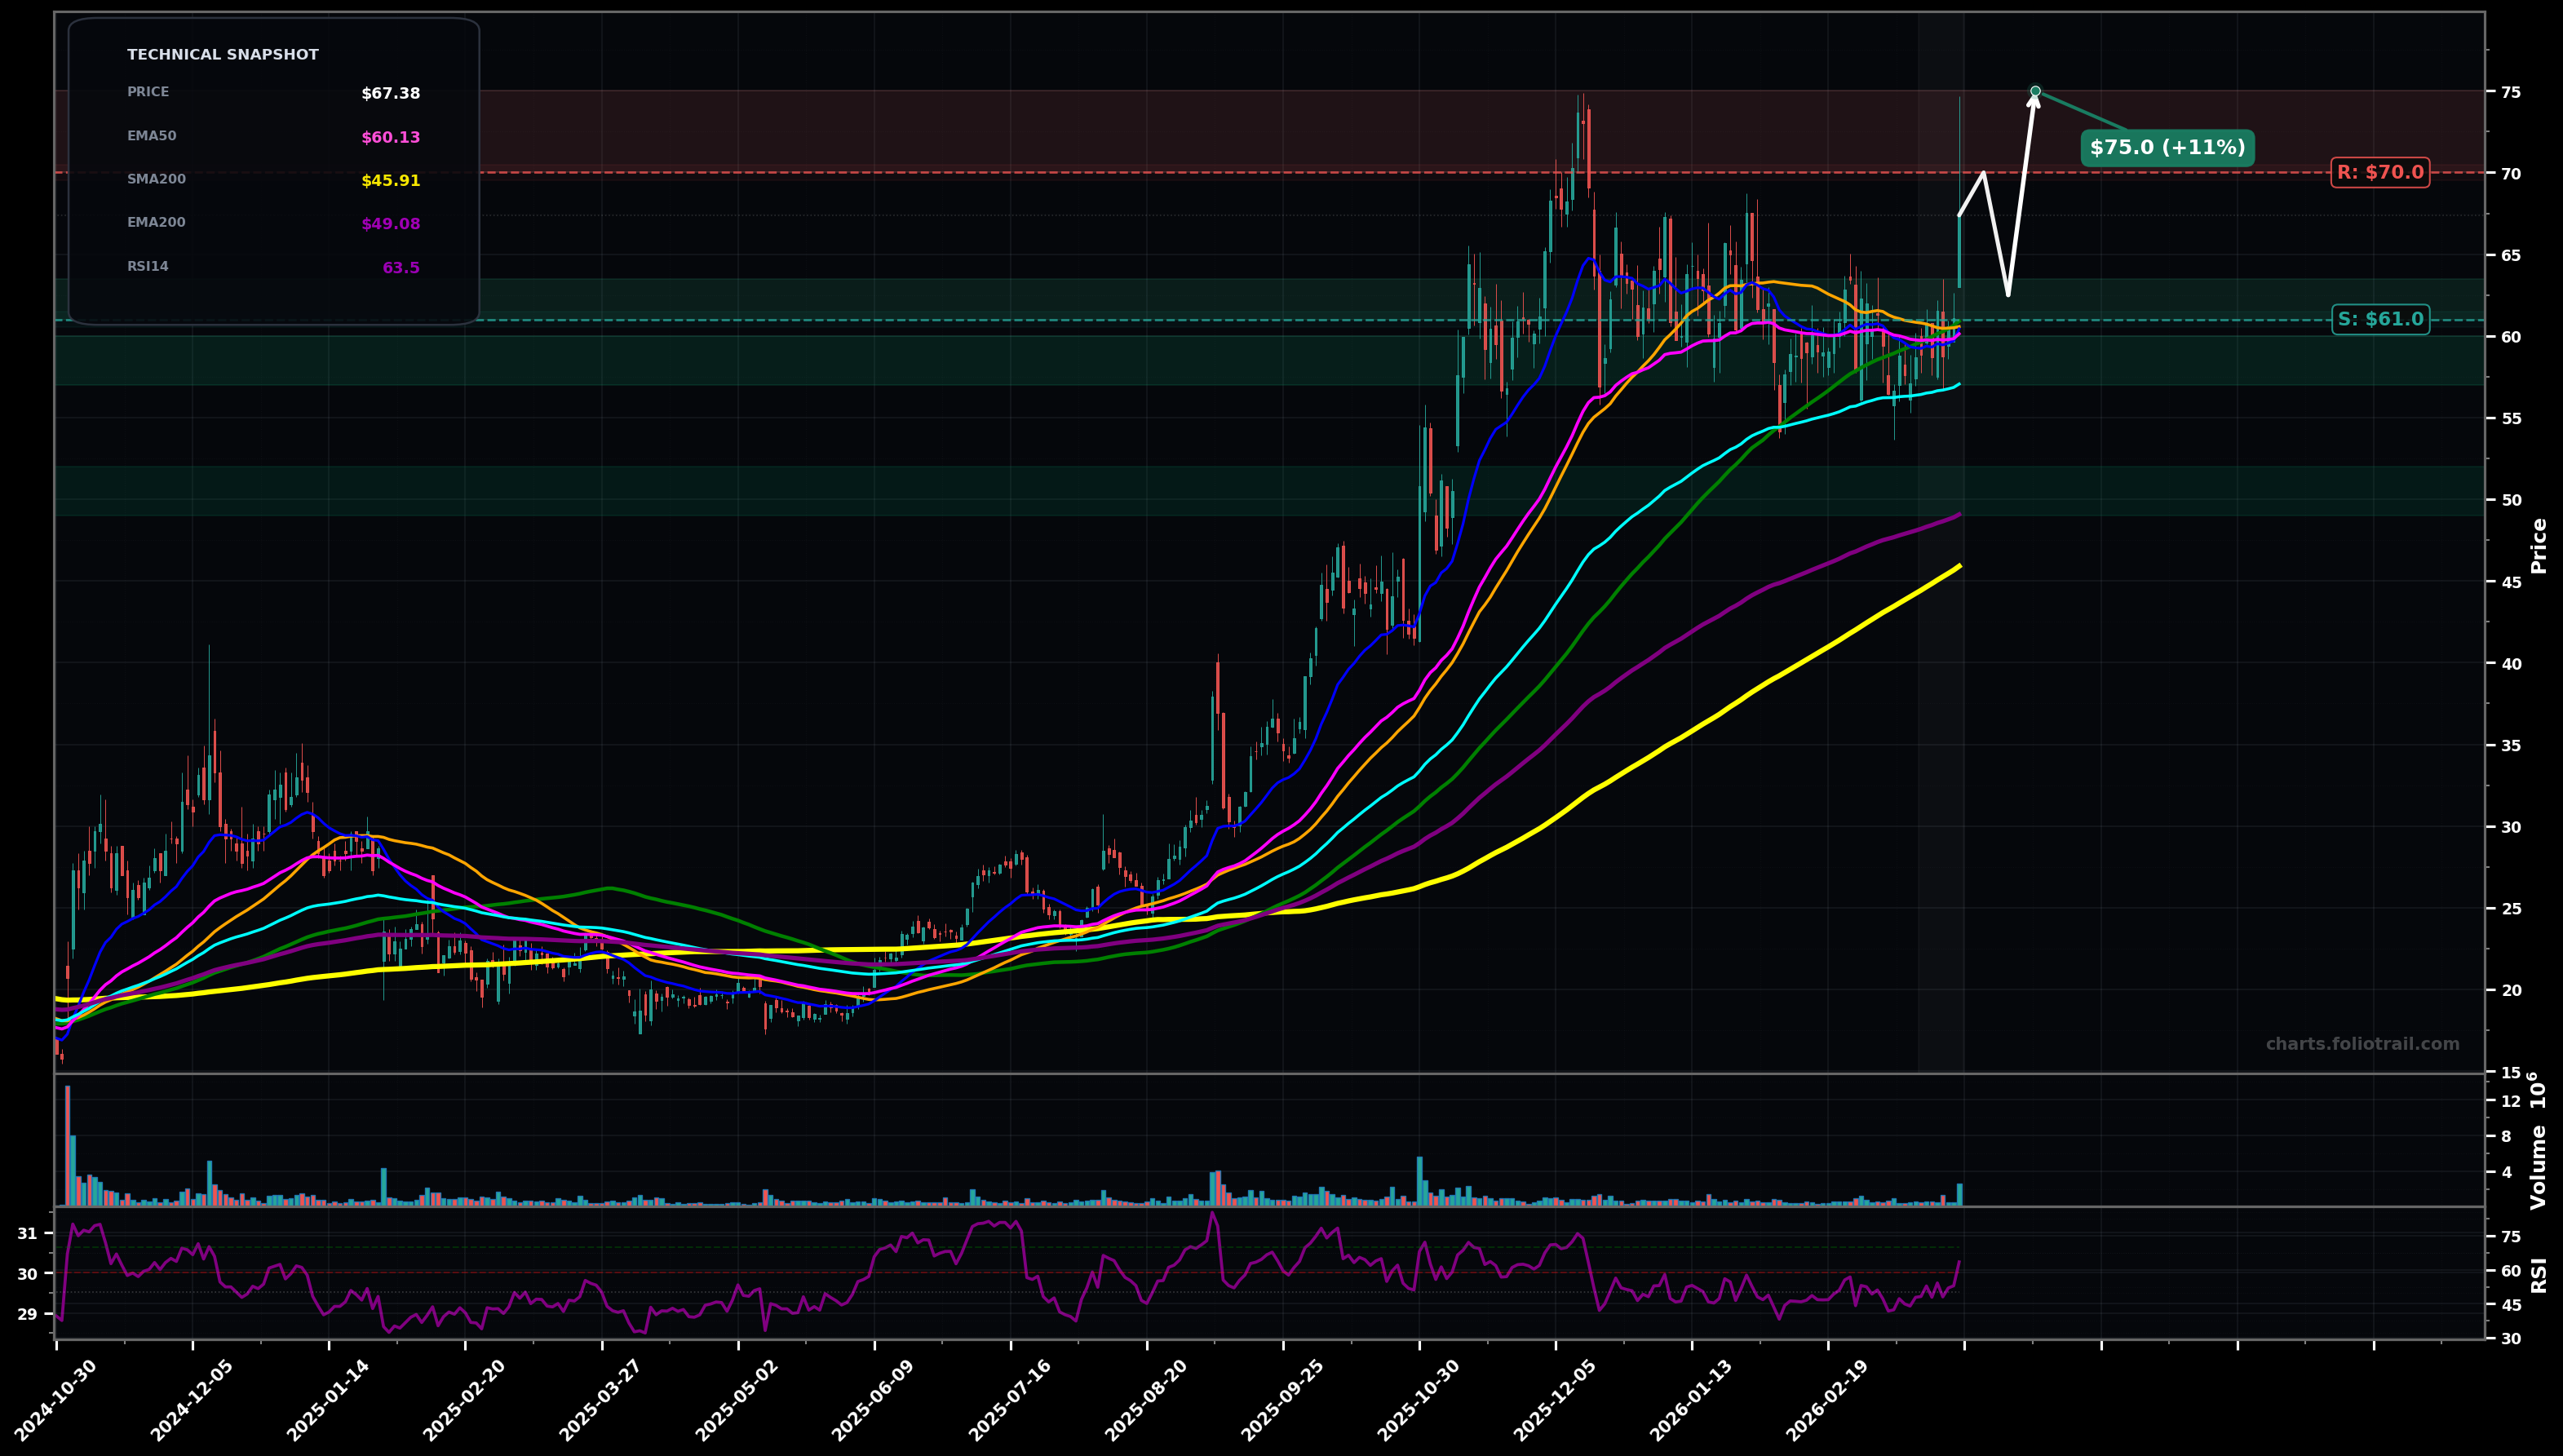
As of March 26, 2026, GSAT (Globalstar, Inc.) is in a breakout reversal state on the daily chart, with a confidence level of 67%. Key support is at $61.0 and key resistance at $70.0. Strong breakout candle pushed price above the ~$60-$61 MA cluster (SMA50/100 & EMA50) with momentum (RSI ~63), after a multi-month sideways consolidation.
Bullish continuation: breakout holds above the reclaimed MA cluster; a brief backtest toward ~$61-$63 is bought, then price grinds higher toward the next resistance band.
Bearish failed breakout: price rejects near ~$70 and loses the ~$61 area, rotating back into the prior range toward the rising mid-term trend supports.
Daily close hold above $61.00 followed by a push/close above $68.00
Daily close back below $59.50
Start on breakout-backtest at reclaimed MA cluster; add on EMA100 retest (~$57); heavy add only on deep mean-reversion toward EMA200 (~$49) / prior swing support.
Trim into overhead supply near prior highs/extension (likely Wave-5/impulse extension); increase trims at major fib extensions; close into extreme multi-year stretch well above long MAs.
As of March 26, 2026, GSAT (Globalstar, Inc.) is in a breakout reversal state on the daily chart with 67% confidence. Strong breakout candle pushed price above the ~$60-$61 MA cluster (SMA50/100 & EMA50) with momentum (RSI ~63), after a multi-month sideways consolidation.
On the daily timeframe, GSAT has key support at $61.0 and key resistance at $70.0. The most likely scenario (bullish) targets $70.0 and $75.0, with a revert level at $62.5.
GSAT (Globalstar, Inc.) is currently classified as breakout reversal on the daily chart, with 67% confidence. Confirmation requires: Daily close hold above $61.00 followed by a push/close above $68.00 This would be invalidated by: Daily close back below $59.50
The most likely scenario (bullish) targets $70.0 and $75.0, with a revert level at $62.5. The alternative scenario (bearish) targets $57.0 and $49.0.
Multi-layer AI agents analyse 200+ stocks across daily, weekly, and monthly timeframes — producing market state classifications, price scenarios with targets, and position entry/exit levels. Updated every trading day after market close. No paywall. No sign-up required.
Built by Foliotrail.
All content on this website — including charts, analysis, price targets, support/resistance levels, and position zones — is generated entirely by AI and provided for educational and informational purposes only.
This is not financial advice. NEXUSNOIR VENTURES SL (the operator of this website) is not a registered investment adviser or broker-dealer. You should not make investment decisions based solely on this information. Always do your own research and consult a qualified financial advisor.
By continuing, you acknowledge that you have read and agree to our full disclaimer & terms of use and privacy policy.