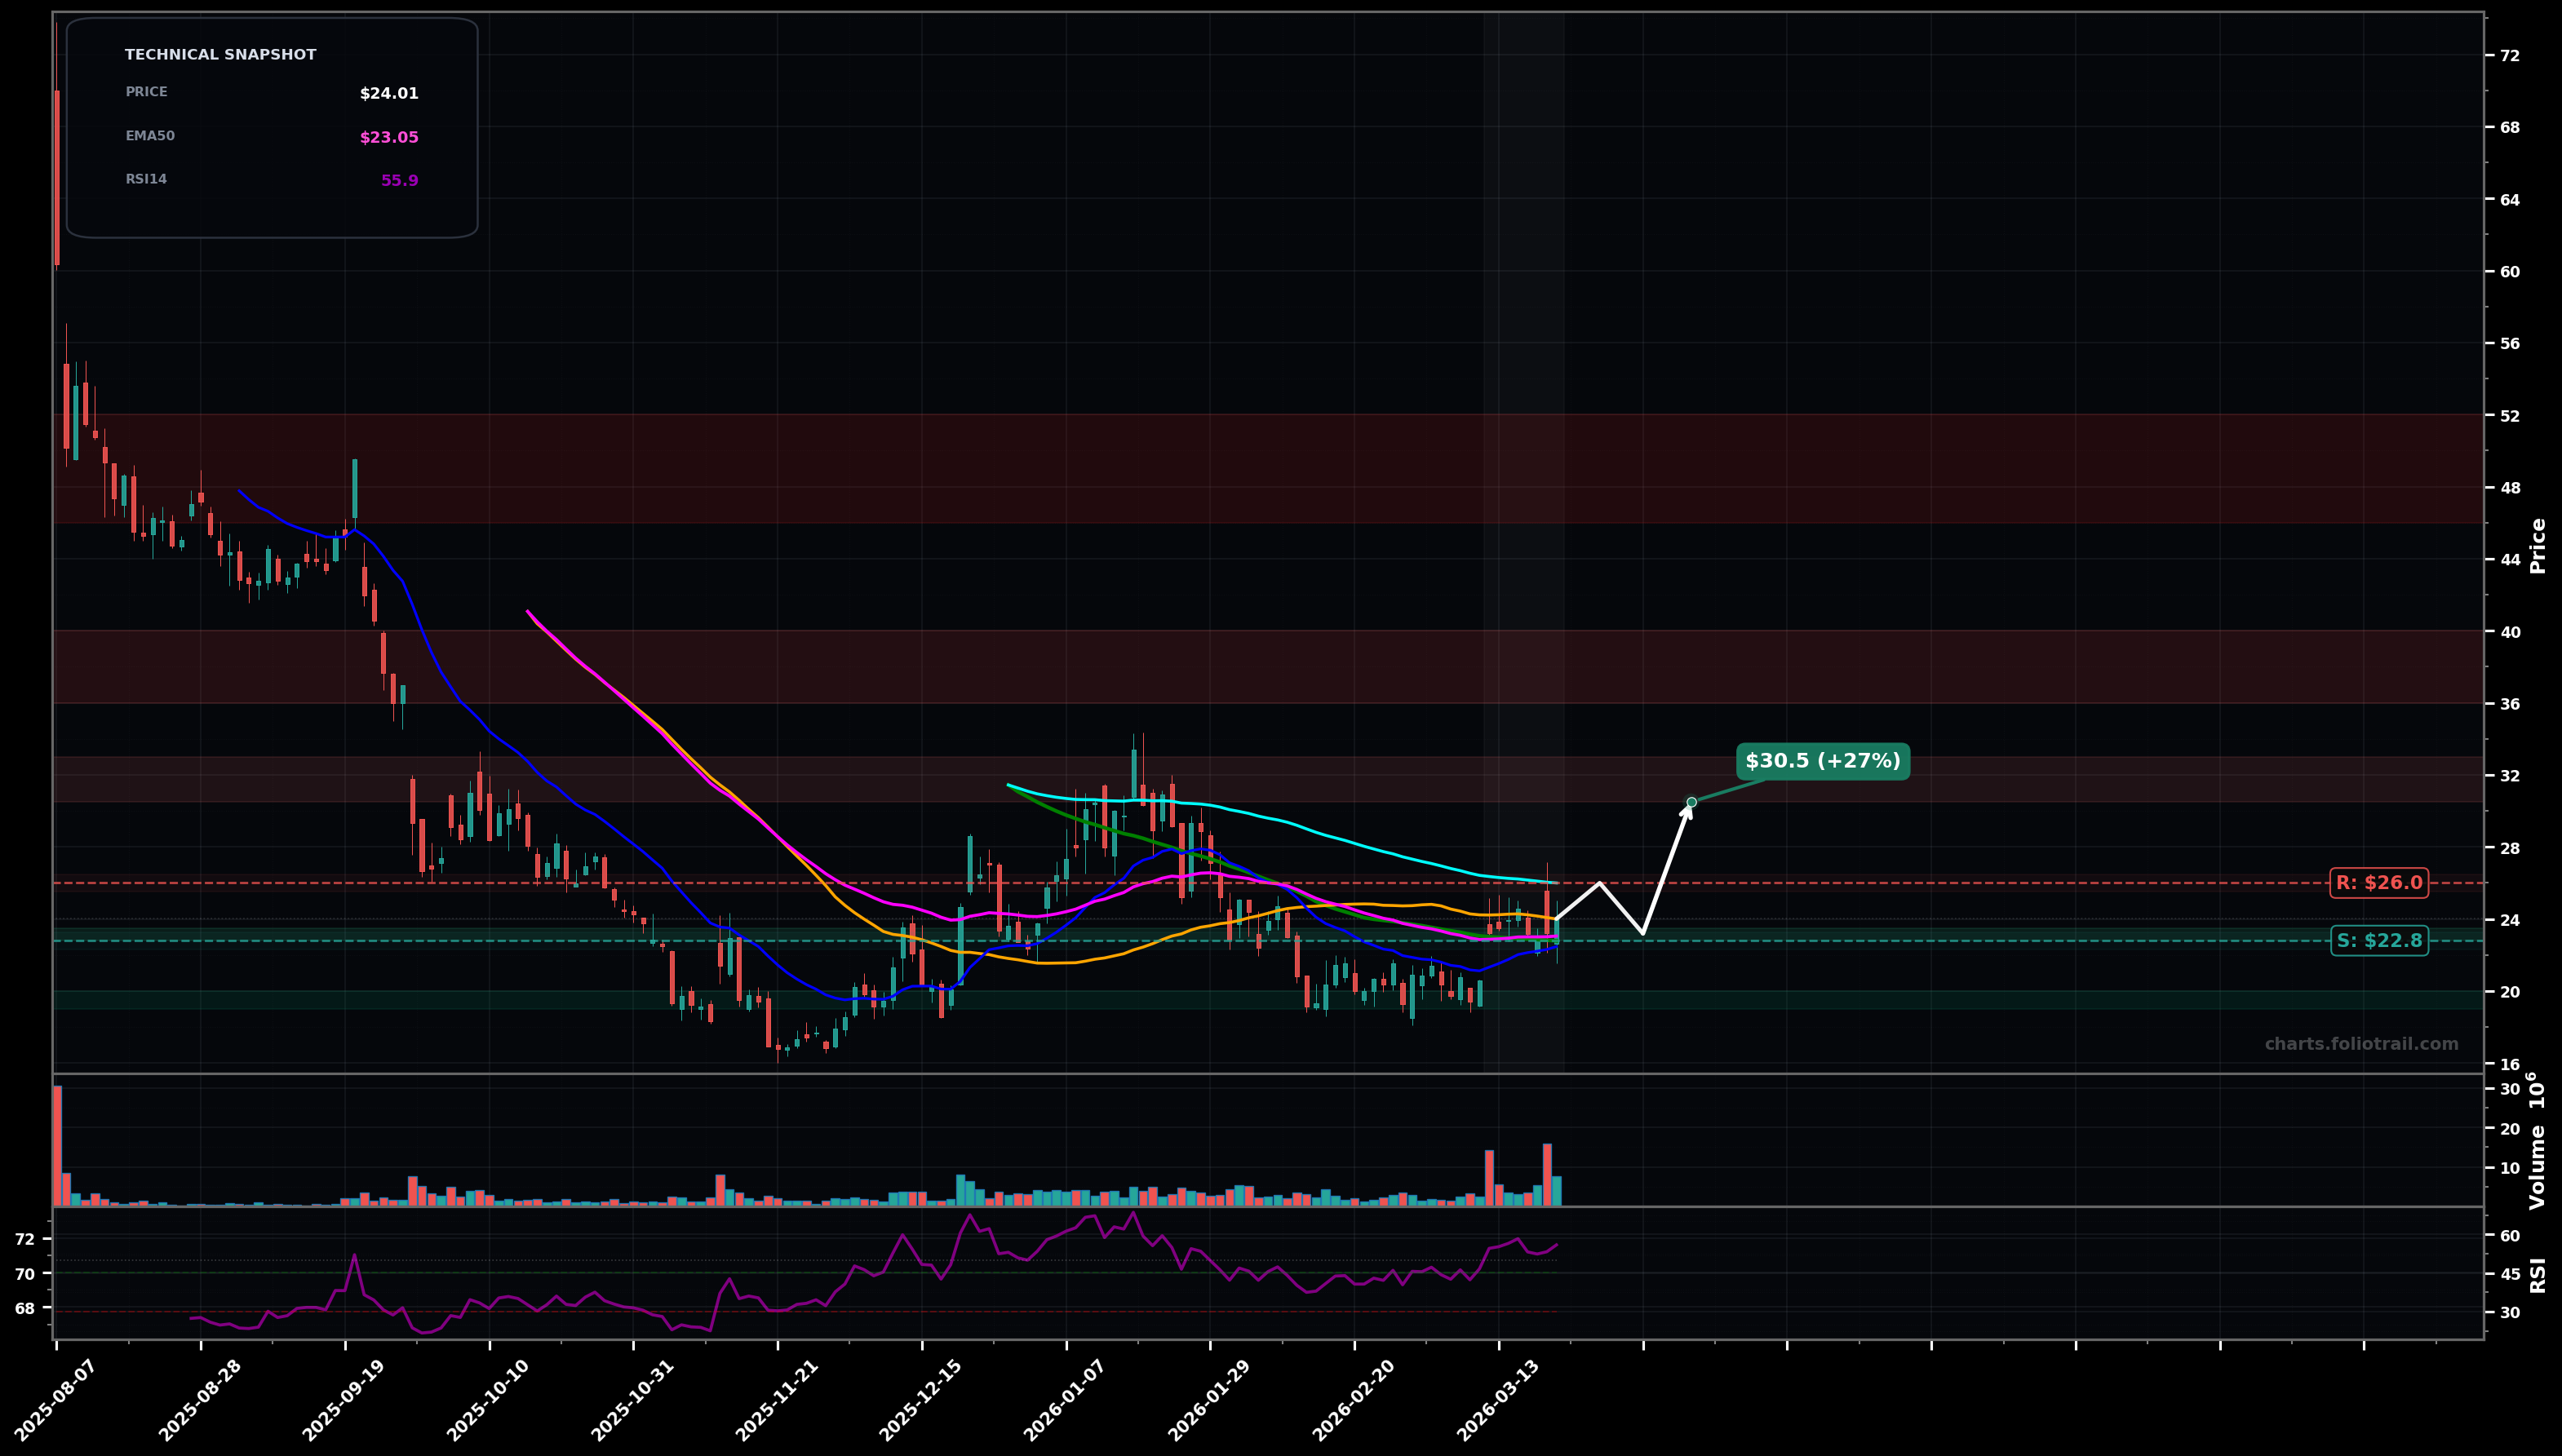
As of March 24, 2026, FLY (Firefly Aerospace Inc.) is in a stabilized base state on the daily chart, with a confidence level of 63%. Key support is at $22.8 and key resistance at $26.0. Price is ~$24.01; compressed sideways with a small breakout attempt and a volume pop, holding near the cluster of short/mid MAs while still capped by the longer MA overhead.
Base continues and resolves upward: pullback holds $23.0-$22.8, then price grinds through $26.0 and targets the prior supply zone; Elliott view: larger corrective structure likely finishing and starting an impulsive Wave (1) attempt; Fib-wise, reclaiming $26 sets up a move toward the next retracement band.
Failed breakout / rejection at $26: price slips back into the range and tests the lower base; Elliott view: still in a corrective Wave (C) / Wave (2) extension; Fib risk is a retest of the prior swing low region if support breaks.
2+ daily closes above $26.00 (EMA100 area) with hold
Daily close below $22.80 (SMA100 / prior base support) reopens breakdown risk
Buy zones are built around the base floor (SMA100/pivot support), then deeper value near the range lows and prior demand if a breakdown flush occurs.
Trim into successive overhead supply areas from prior breakdown (mid-$30s) and the larger multi-month distribution zone (mid/high-$40s to low-$50s) where risk/reward typically worsens.
As of March 24, 2026, FLY (Firefly Aerospace Inc.) is in a stabilized base state on the daily chart with 63% confidence. Price is ~$24.01; compressed sideways with a small breakout attempt and a volume pop, holding near the cluster of short/mid MAs while still capped by the longer MA overhead.
On the daily timeframe, FLY has key support at $22.8 and key resistance at $26.0. The most likely scenario (bullish) targets $26.0 and $30.5, with a revert level at $23.2.
FLY (Firefly Aerospace Inc.) is currently classified as stabilized base on the daily chart, with 63% confidence. Confirmation requires: 2+ daily closes above $26.00 (EMA100 area) with hold This would be invalidated by: Daily close below $22.80 (SMA100 / prior base support) reopens breakdown risk
The most likely scenario (bullish) targets $26.0 and $30.5, with a revert level at $23.2. The alternative scenario (bearish) targets $22.8 and $20.0.
All content on this website — including charts, analysis, price targets, support/resistance levels, and position zones — is generated entirely by AI and provided for educational and informational purposes only.
This is not financial advice. NEXUSNOIR VENTURES SL (the operator of this website) is not a registered investment adviser or broker-dealer. You should not make investment decisions based solely on this information. Always do your own research and consult a qualified financial advisor.
By continuing, you acknowledge that you have read and agree to our full disclaimer & terms of use and privacy policy.