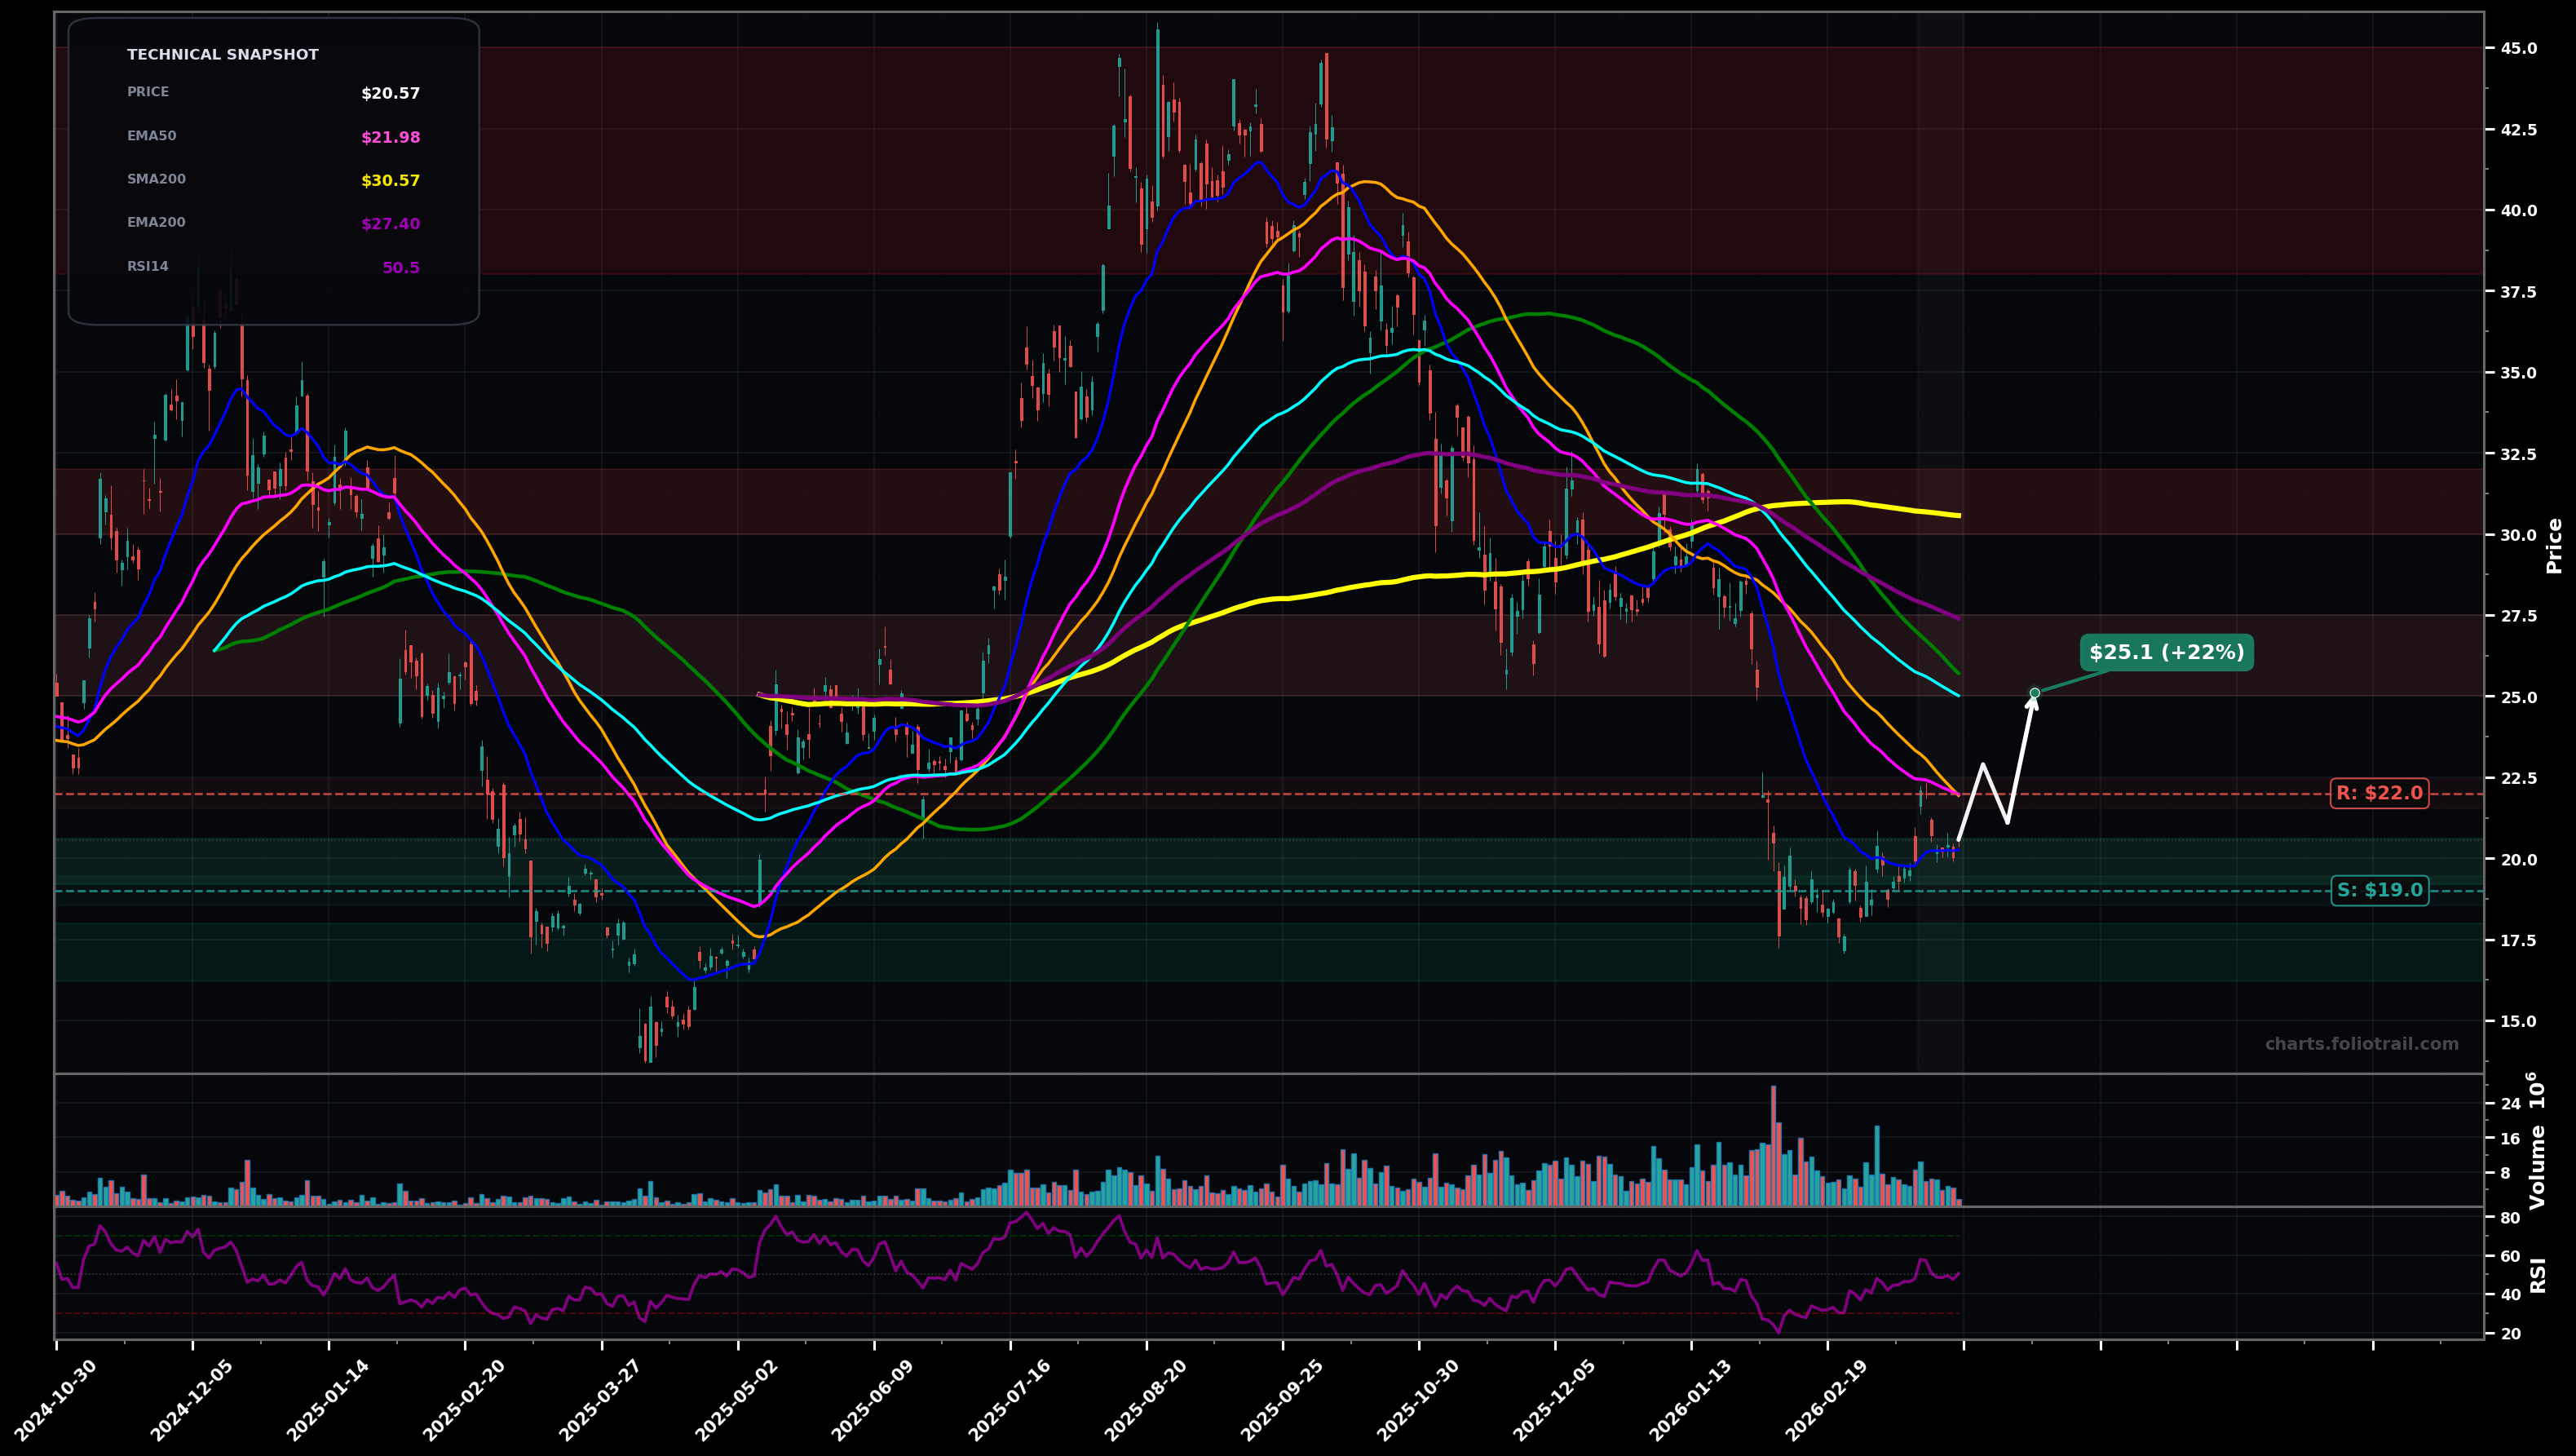
As of March 26, 2026, ETH (Grayscale Ethereum Mini Trust ETF) is in a bottoming attempt state on the daily chart, with a confidence level of 62%. Key support is at $19.0 and key resistance at $22.0. Price at $20.57 is bouncing off a recent swing-low base (~$18.5-$19) but remains below falling EMA50 ($21.98) and EMA100 ($25.01); RSI ~50 shows momentum stabilizing rather than trending.
Base holds and price reclaims EMA50 (~$22) then mean-reverts toward the next confluence resistance (EMA100/structure).
Support fails and the downtrend resumes (likely wave-5 continuation) with a breakdown from the $19-$21 base.
Daily close above $22.10 for 2+ sessions (reclaim EMA50 area) would confirm the bottoming attempt
Daily close below $18.50 would invalidate and re-open downside continuation
Scale in at base support and prior pivot demand; add on retest/undercut of swing-low support; heavy add only if capitulation flush toward next fib-extension/air-pocket zone.
Trim into MA/structure supply (EMA100→EMA200/SMA zones) and major prior distribution range; fully exit into a return to the prior swing-top region where upside becomes asymmetrically stretched.
As of March 26, 2026, ETH (Grayscale Ethereum Mini Trust ETF) is in a bottoming attempt state on the daily chart with 62% confidence. Price at $20.57 is bouncing off a recent swing-low base (~$18.5-$19) but remains below falling EMA50 ($21.98) and EMA100 ($25.01); RSI ~50 shows momentum stabilizing rather than trending.
On the daily timeframe, ETH has key support at $19.0 and key resistance at $22.0. The most likely scenario (bullish) targets $22.9 and $25.1, with a revert level at $21.1.
ETH (Grayscale Ethereum Mini Trust ETF) is currently classified as bottoming attempt on the daily chart, with 62% confidence. Confirmation requires: Daily close above $22.10 for 2+ sessions (reclaim EMA50 area) would confirm the bottoming attempt This would be invalidated by: Daily close below $18.50 would invalidate and re-open downside continuation
The most likely scenario (bullish) targets $22.9 and $25.1, with a revert level at $21.1. The alternative scenario (bearish) targets $18.5 and $16.2.
Multi-layer AI agents analyse 200+ stocks across daily, weekly, and monthly timeframes — producing market state classifications, price scenarios with targets, and position entry/exit levels. Updated every trading day after market close. No paywall. No sign-up required.
Built by Foliotrail.
All content on this website — including charts, analysis, price targets, support/resistance levels, and position zones — is generated entirely by AI and provided for educational and informational purposes only.
This is not financial advice. NEXUSNOIR VENTURES SL (the operator of this website) is not a registered investment adviser or broker-dealer. You should not make investment decisions based solely on this information. Always do your own research and consult a qualified financial advisor.
By continuing, you acknowledge that you have read and agree to our full disclaimer & terms of use and privacy policy.