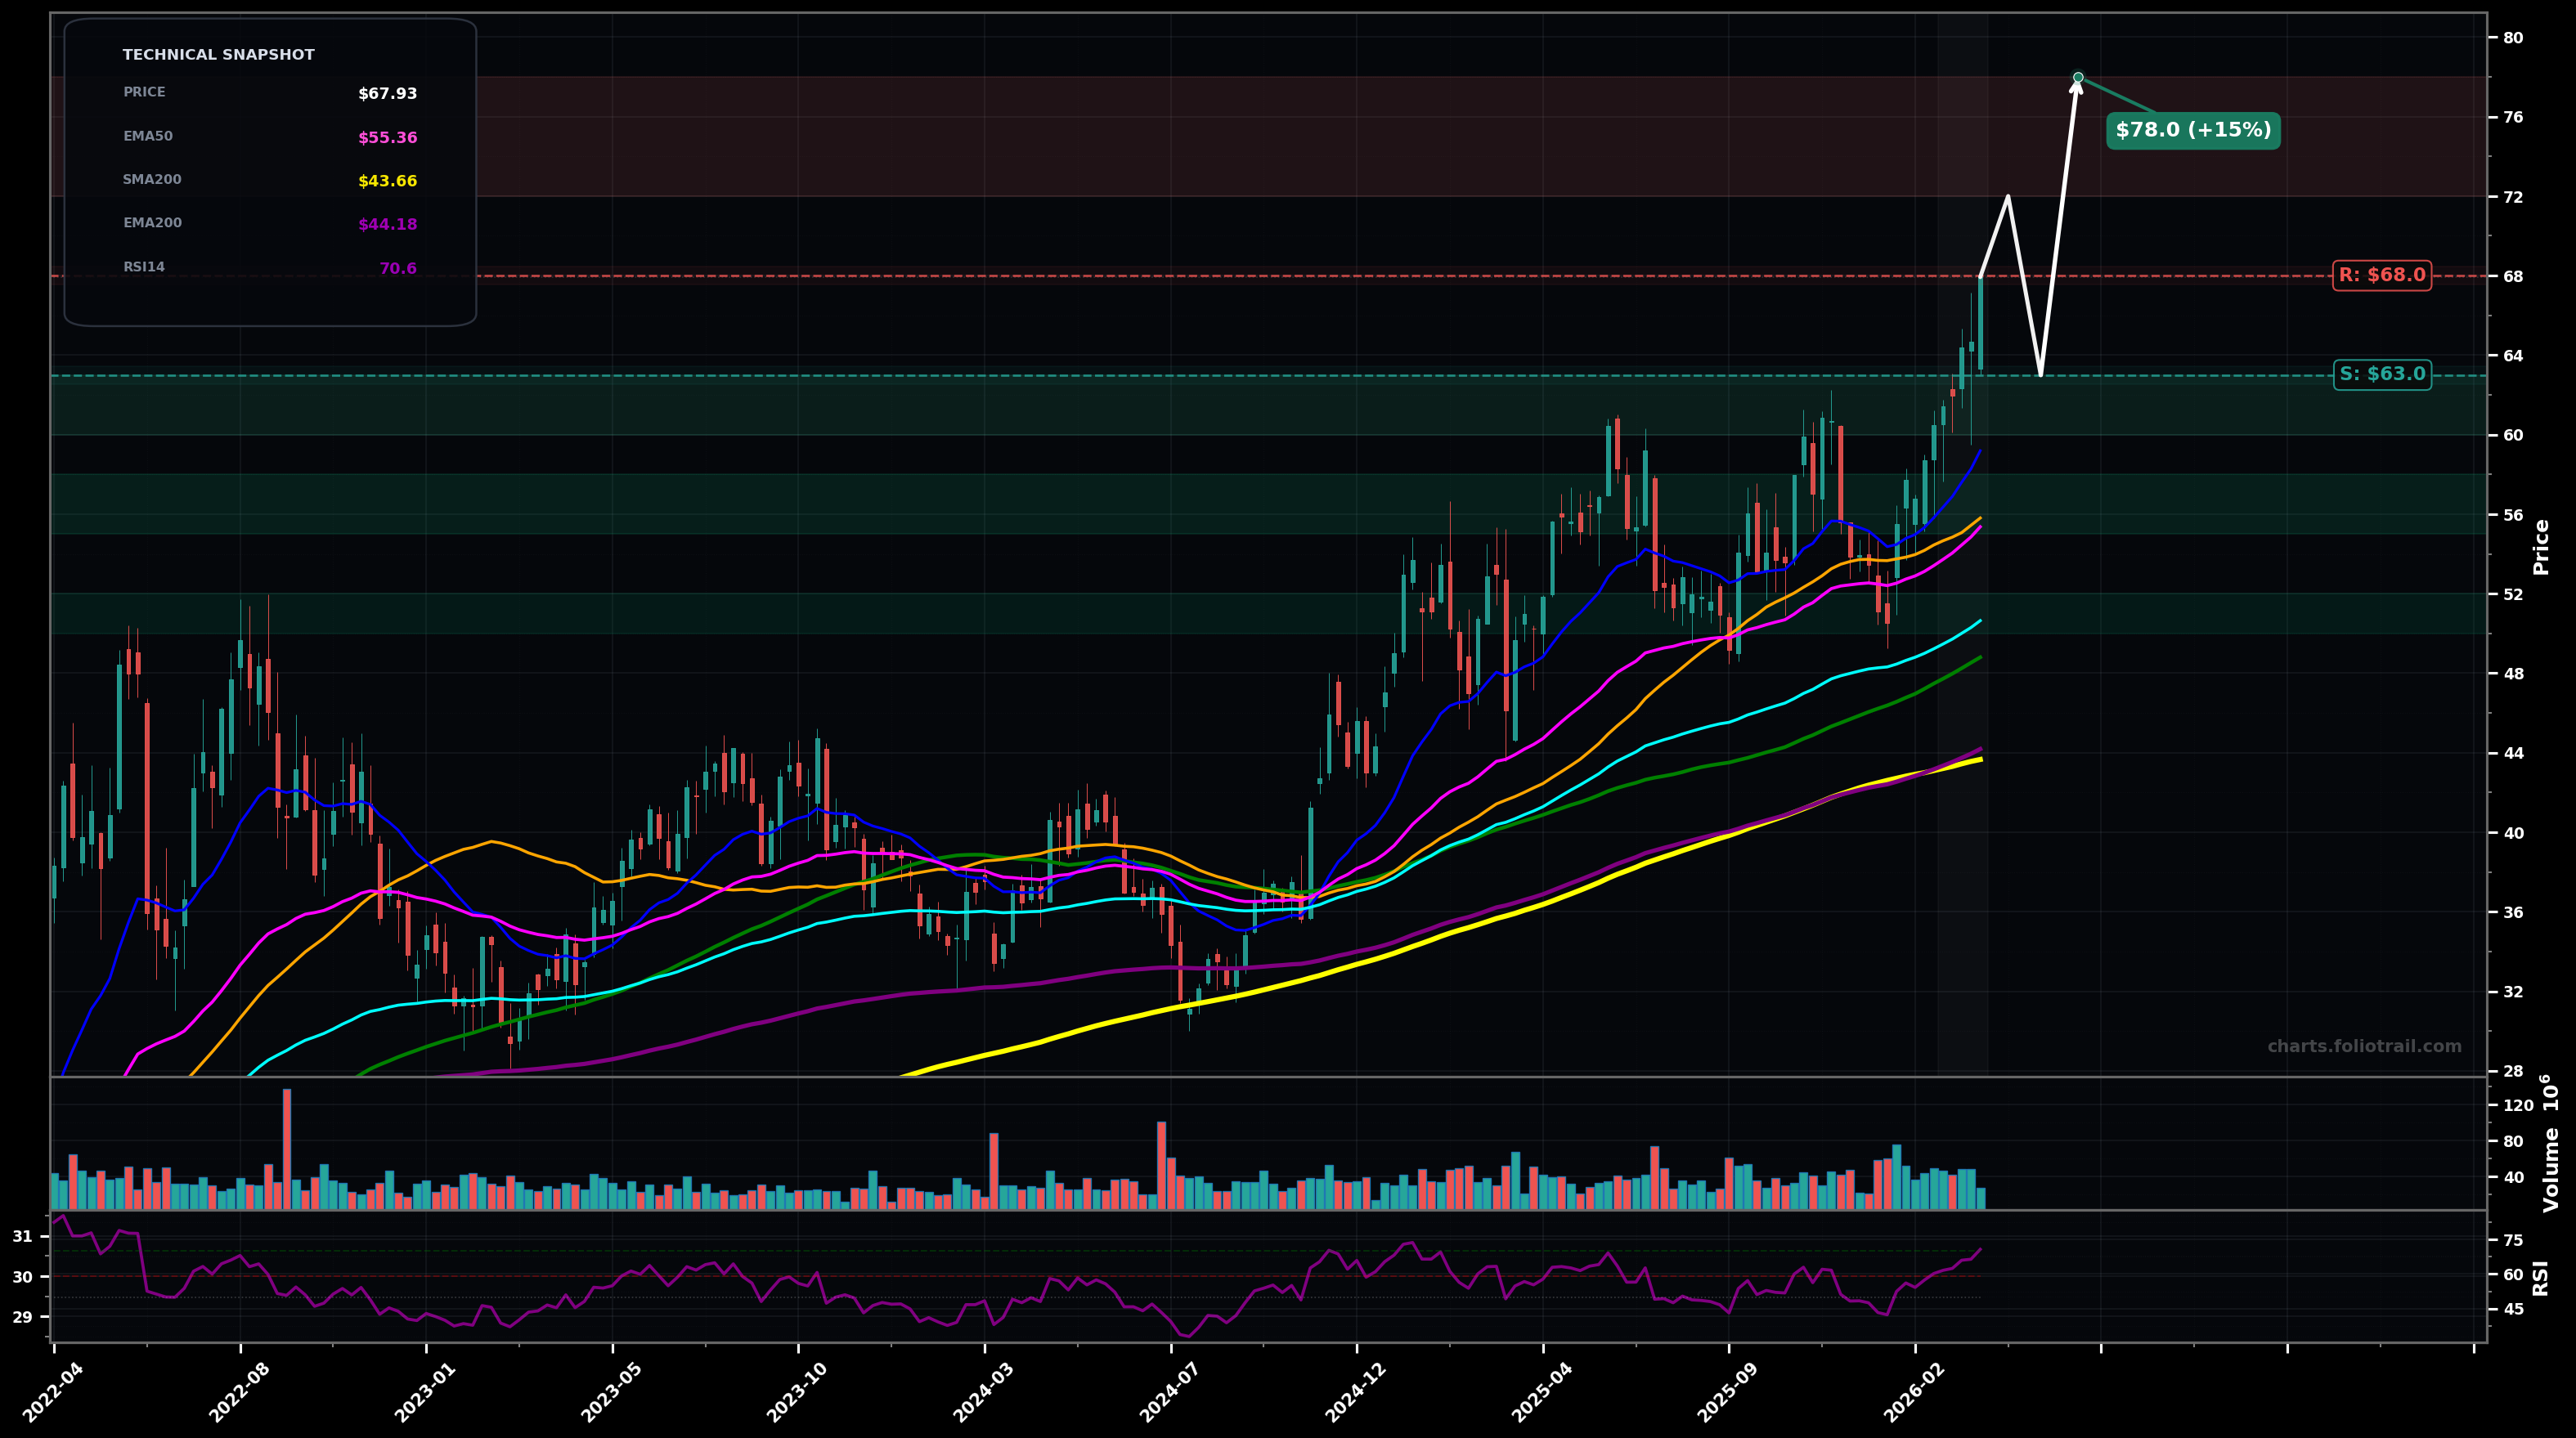
As of March 26, 2026, EQT (EQT Corporation) is in a uptrend state on the weekly chart, with a confidence level of 78%. Key support is at $63.0 and key resistance at $68.0. Weekly breakout to new swing highs; strong green candles with price extended above rising EMA50/EMA100 and RSI ~70 (overbought zone).
Bullish continuation (Elliott: late Wave 3 / early Wave 5 extension) with a brief consolidation/pullback to the breakout zone, then push to the next Fibonacci extension area.
Deeper corrective pullback (Elliott: Wave 4-type correction) as RSI cools; price mean-reverts toward the rising EMA50/previous structure before trend attempts to resume.
Hold above $63.00 on weekly closes (prior breakout/swing area) for 2+ weeks.
Weekly close below $55.00 (loss of EMA50/SMA50 confluence).
Buy-the-dip levels are anchored to prior breakout support (~$63), EMA50/SMA50 confluence (~$55-$58), and EMA100/structure shelf (~$50-$52) if a Wave-4 pullback develops.
Trim into Fibonacci-extension/overbought conditions after a multi-month HH/HL run; escalate trimming if price accelerates far above EMA50/EMA100 (parabolic risk) and volume spikes into highs.
As of March 26, 2026, EQT (EQT Corporation) is in a uptrend state on the weekly chart with 78% confidence. Weekly breakout to new swing highs; strong green candles with price extended above rising EMA50/EMA100 and RSI ~70 (overbought zone).
On the weekly timeframe, EQT has key support at $63.0 and key resistance at $68.0. The most likely scenario (bullish) targets $72.0 and $78.0, with a revert level at $63.0.
EQT (EQT Corporation) is currently classified as uptrend on the weekly chart, with 78% confidence. Confirmation requires: Hold above $63.00 on weekly closes (prior breakout/swing area) for 2+ weeks. This would be invalidated by: Weekly close below $55.00 (loss of EMA50/SMA50 confluence).
The most likely scenario (bullish) targets $72.0 and $78.0, with a revert level at $63.0. The alternative scenario (bearish) targets $58.0 and $51.0.
Multi-layer AI agents analyse 200+ stocks across daily, weekly, and monthly timeframes — producing market state classifications, price scenarios with targets, and position entry/exit levels. Updated every trading day after market close. No paywall. No sign-up required.
Built by Foliotrail.
All content on this website — including charts, analysis, price targets, support/resistance levels, and position zones — is generated entirely by AI and provided for educational and informational purposes only.
This is not financial advice. NEXUSNOIR VENTURES SL (the operator of this website) is not a registered investment adviser or broker-dealer. You should not make investment decisions based solely on this information. Always do your own research and consult a qualified financial advisor.
By continuing, you acknowledge that you have read and agree to our full disclaimer & terms of use and privacy policy.