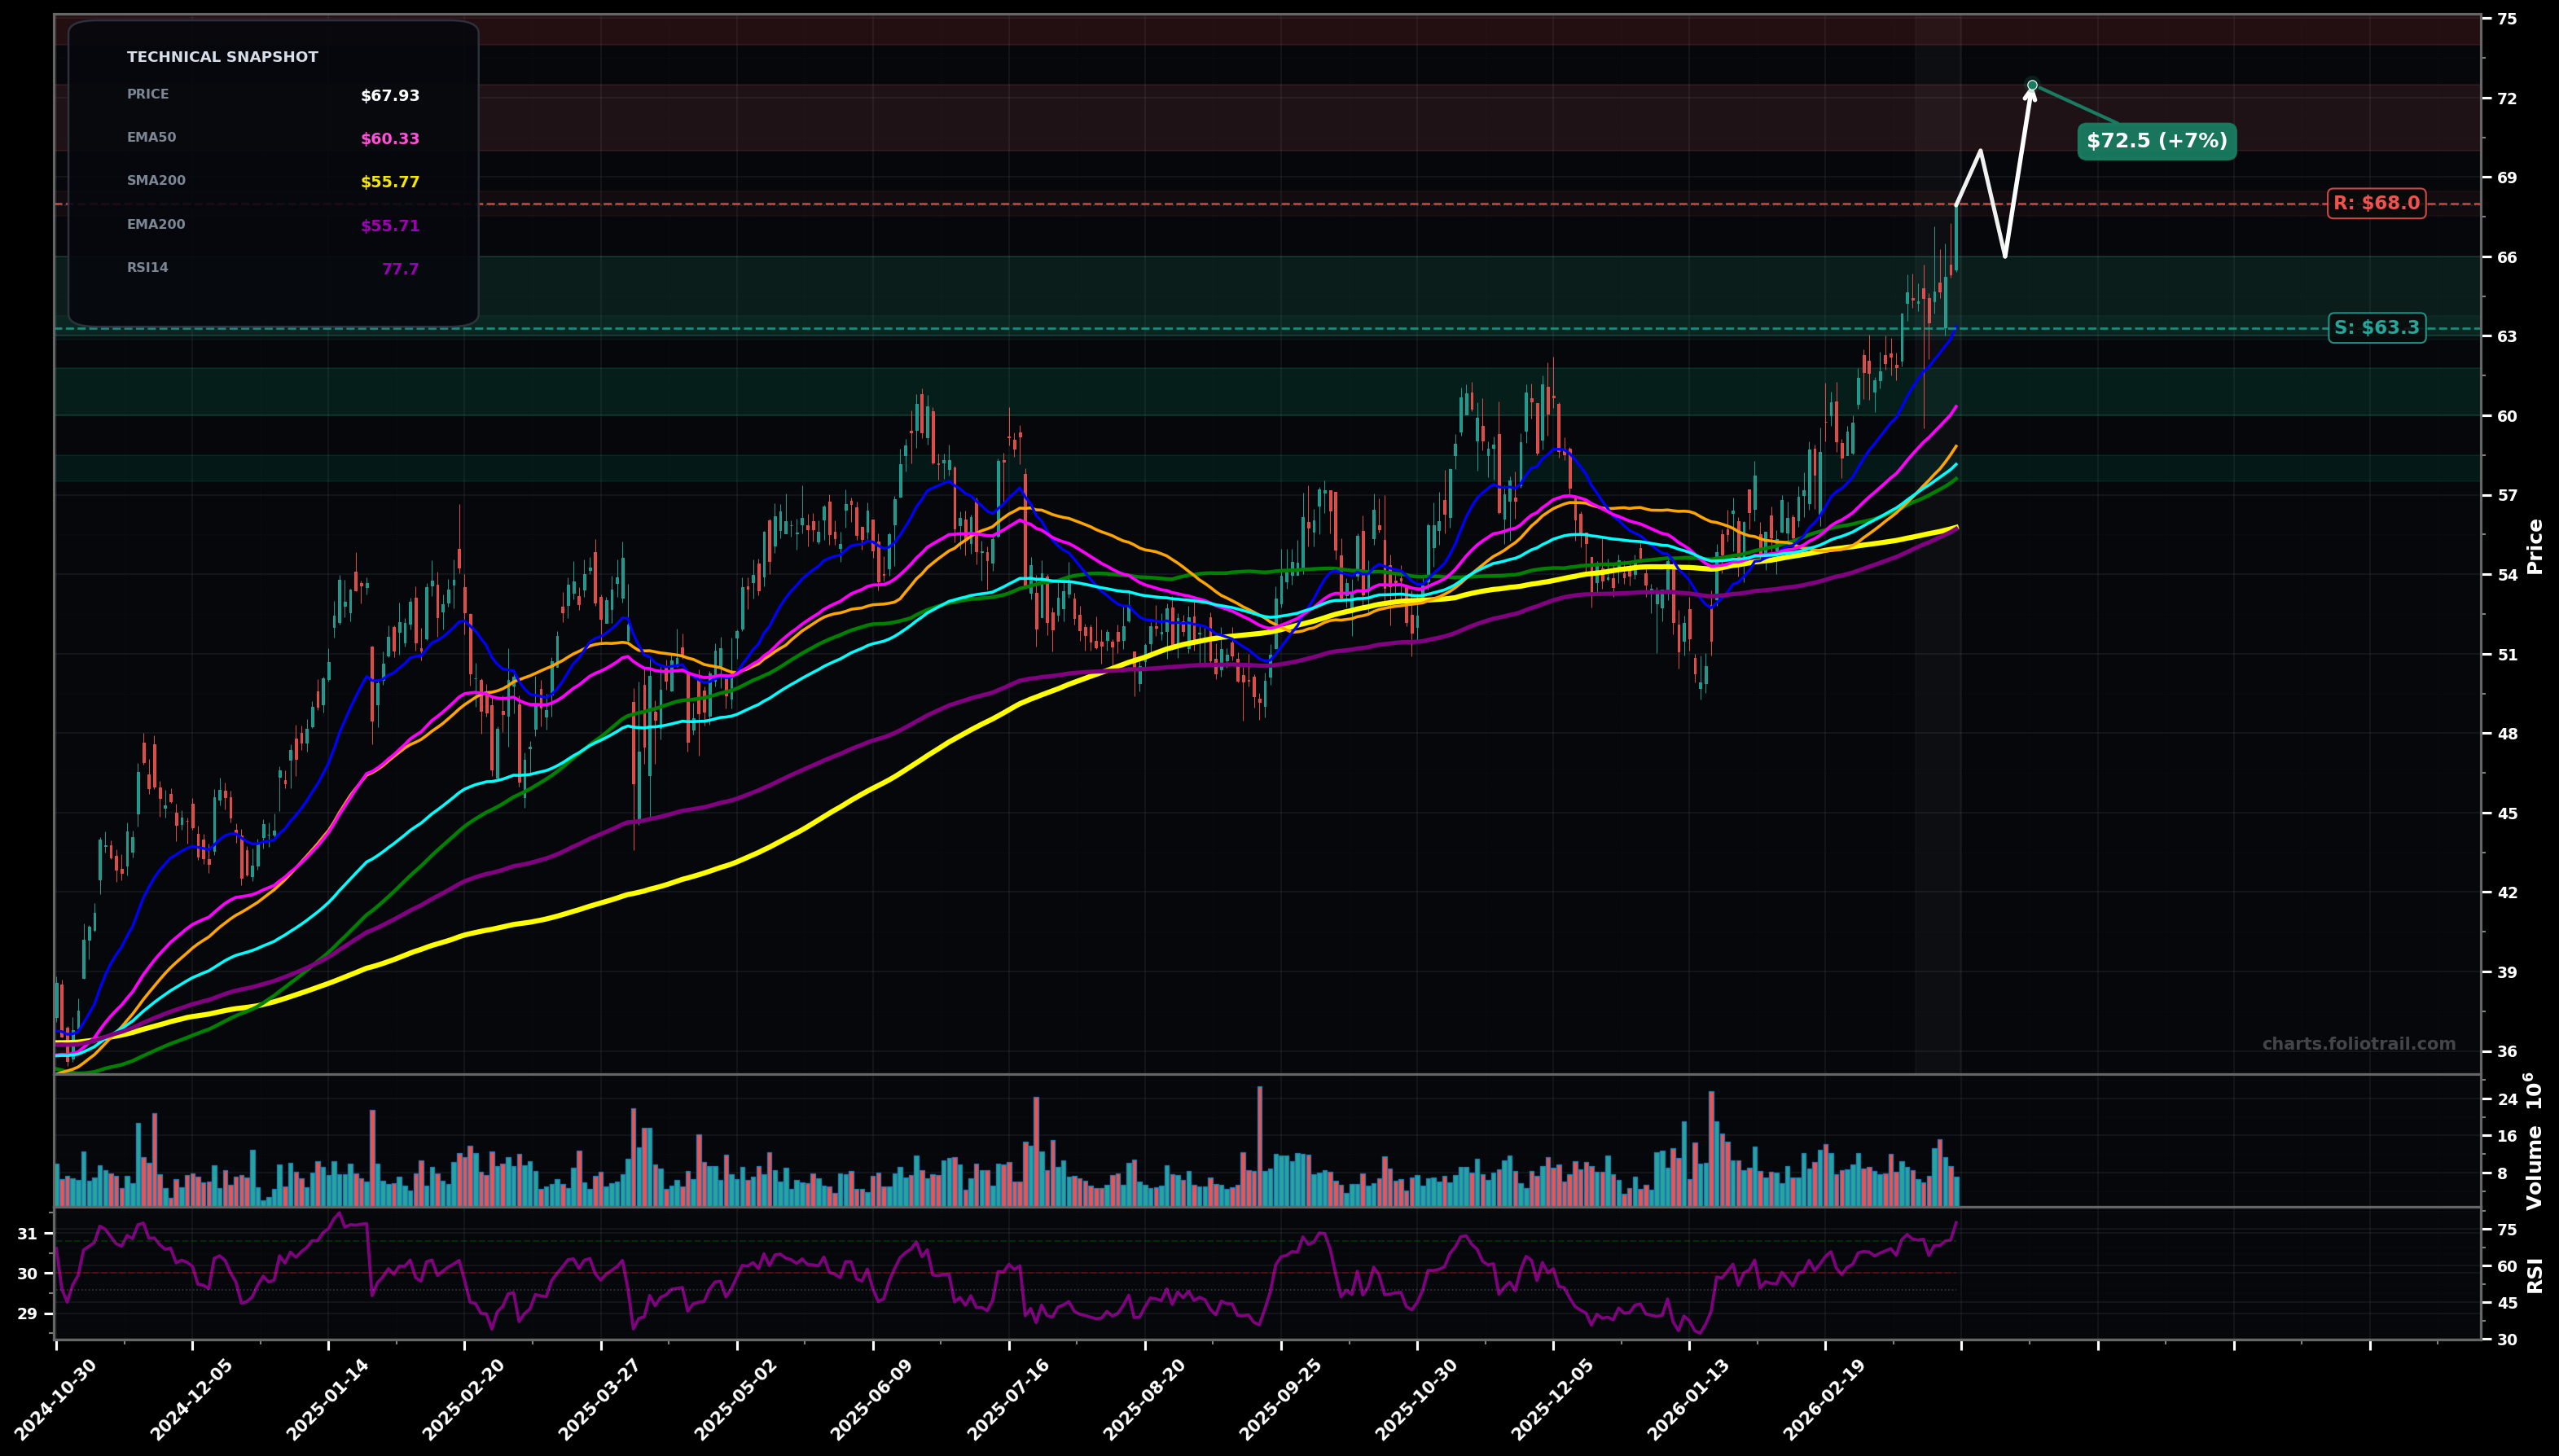
As of March 26, 2026, EQT (EQT Corporation) is in a parabolic state on the daily chart, with a confidence level of 62%. Key support is at $63.3 and key resistance at $68.0. Price broke to new swing highs and is extending above all key MAs; RSI is elevated (~78) suggesting momentum but near-term pullback risk.
Most likely: momentum continues but with a brief consolidation/pullback to the breakout area, then another push higher (Elliott: wave 5 extension or late wave 3 continuation). Fib: measured extension targets above the recent $50→$68 impulse suggest next round-number magnet.
Second most likely: mean-reversion pullback as RSI cools; price retraces toward the rising EMA50/cluster of short MAs before attempting to re-base (Elliott: wave 4-style correction), with risk of a deeper retrace if $63 breaks.
Daily closes hold above $66.00 (no breakdown back into the prior breakout area) for 2+ sessions
Daily close below $63.30 (loss of EMA20 area + momentum break) would negate the parabolic extension thesis
Buy-the-dip structure: $63-$66 = breakout retest/EMA20 area; $60-$62 = EMA50 confluence; $57.5-$58.5 = EMA100/SMA50 zone and prior structure support if correction deepens.
Trim into extensions: $70-$72.5 first psychological + extension zone; $74-$78 if price stays stretched above EMA50; $80-$85 only if a blow-off continuation prints far above rising averages (high reversal risk).
As of March 26, 2026, EQT (EQT Corporation) is in a parabolic state on the daily chart with 62% confidence. Price broke to new swing highs and is extending above all key MAs; RSI is elevated (~78) suggesting momentum but near-term pullback risk.
On the daily timeframe, EQT has key support at $63.3 and key resistance at $68.0. The most likely scenario (bullish) targets $70.0 and $72.5, with a revert level at $66.0.
EQT (EQT Corporation) is currently classified as parabolic on the daily chart, with 62% confidence. Confirmation requires: Daily closes hold above $66.00 (no breakdown back into the prior breakout area) for 2+ sessions This would be invalidated by: Daily close below $63.30 (loss of EMA20 area + momentum break) would negate the parabolic extension thesis
The most likely scenario (bullish) targets $70.0 and $72.5, with a revert level at $66.0. The alternative scenario (bearish) targets $61.0 and $58.2.
Multi-layer AI agents analyse 200+ stocks across daily, weekly, and monthly timeframes — producing market state classifications, price scenarios with targets, and position entry/exit levels. Updated every trading day after market close. No paywall. No sign-up required.
Built by Foliotrail.
All content on this website — including charts, analysis, price targets, support/resistance levels, and position zones — is generated entirely by AI and provided for educational and informational purposes only.
This is not financial advice. NEXUSNOIR VENTURES SL (the operator of this website) is not a registered investment adviser or broker-dealer. You should not make investment decisions based solely on this information. Always do your own research and consult a qualified financial advisor.
By continuing, you acknowledge that you have read and agree to our full disclaimer & terms of use and privacy policy.