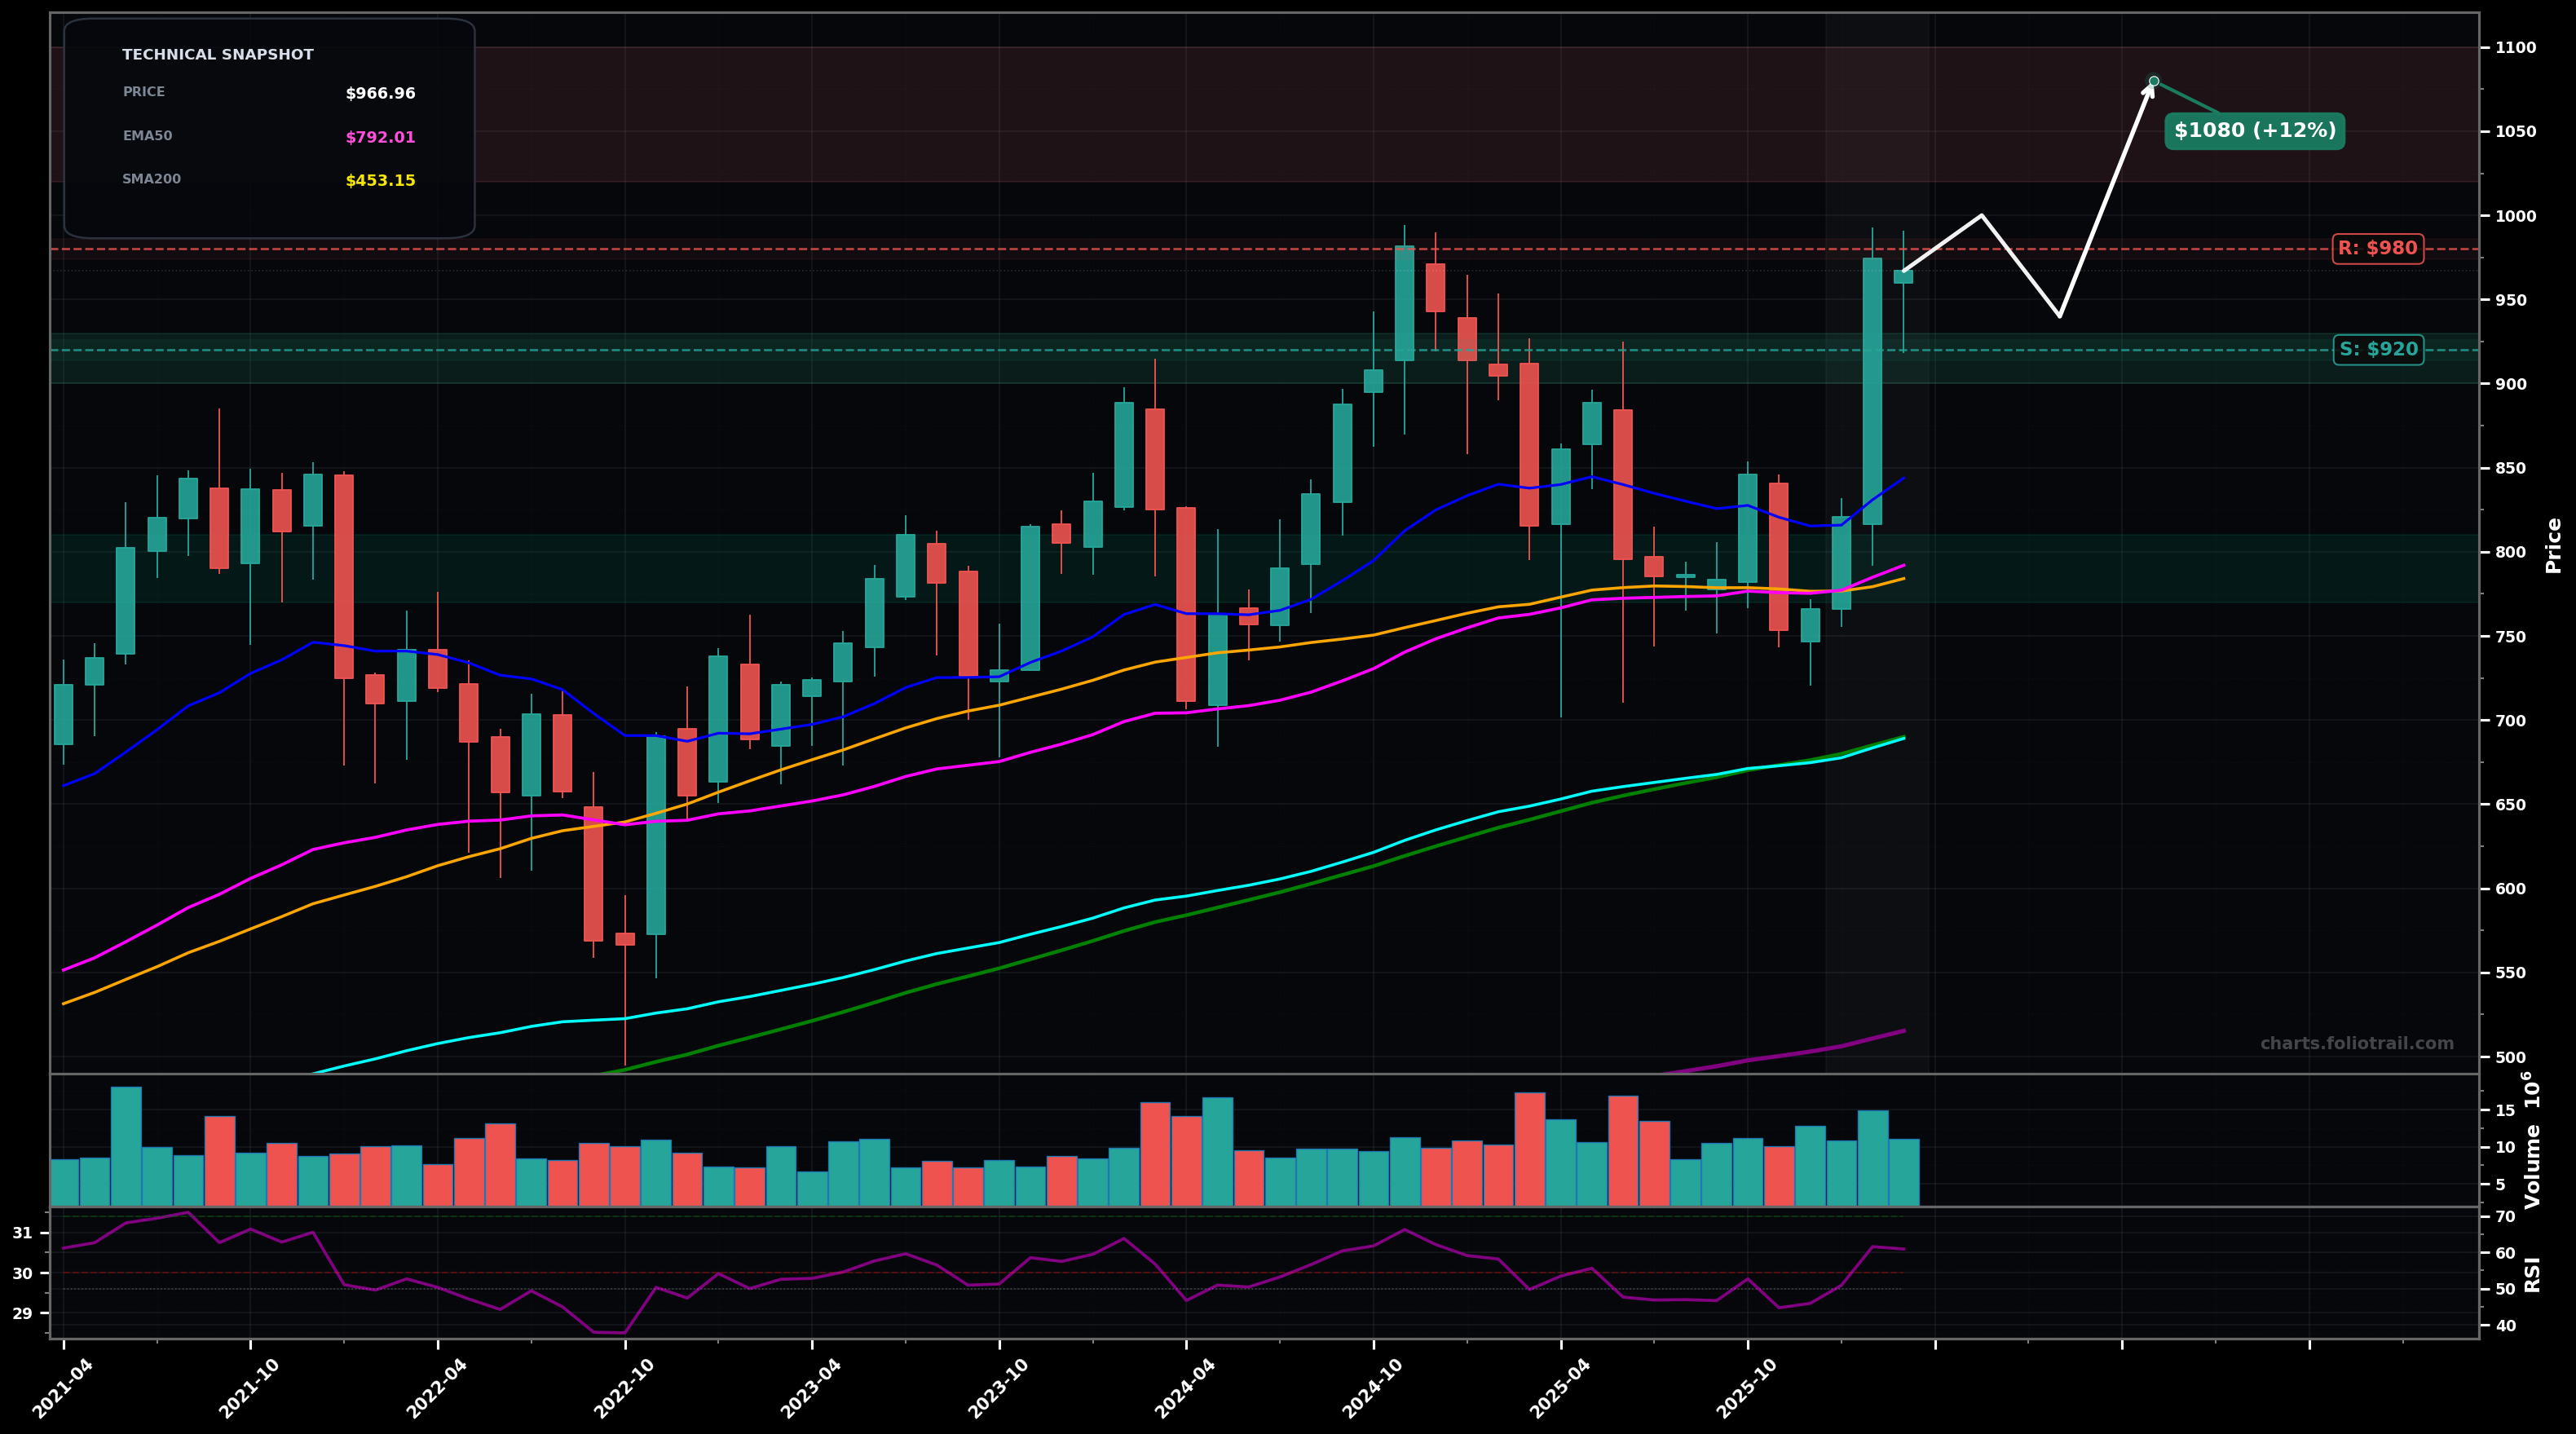
As of March 24, 2026, EQIX (Equinix, Inc.) is in a uptrend state on the monthly chart, with a confidence level of 67%. Key support is at $920 and key resistance at $980. Monthly price is at ~$966 after a strong impulsive push back to prior highs; price is extended above the rising EMA50/EMA100 with RSI ~61.
Bullish continuation: price consolidates under the ~$980 ceiling, then breaks to a new HH; Elliott wave read = late wave 3 or wave 5 extension (momentum strong but not parabolic), with a typical shallow wave-4 style pause before the next leg.
Bearish pullback/retest: a rejection near ~$980 forms a LH on the next upswing and triggers a deeper mean-reversion toward the MA cluster; Elliott wave alt = wave 5 topped and an ABC correction starts, aiming for fib retrace of the last impulse leg.
2+ monthly closes holding above ~$920
Monthly close back below ~$780
Start on first pullback to broken resistance/support (~$920); add on deeper retrace toward prior swing support; heavy add near the MA cluster (SMA50/EMA50 region) where trend often resets if the uptrend is intact.
Trim into potential fib extensions/new-high air pockets above ~$1,000; increase trimming as price gets progressively more stretched from EMA50/100; full exit only if a multi-year extension blow-off develops.
As of March 24, 2026, EQIX (Equinix, Inc.) is in a uptrend state on the monthly chart with 67% confidence. Monthly price is at ~$966 after a strong impulsive push back to prior highs; price is extended above the rising EMA50/EMA100 with RSI ~61.
On the monthly timeframe, EQIX has key support at $920 and key resistance at $980. The most likely scenario (bullish) targets $1000 and $1080, with a revert level at $940.
EQIX (Equinix, Inc.) is currently classified as uptrend on the monthly chart, with 67% confidence. Confirmation requires: 2+ monthly closes holding above ~$920 This would be invalidated by: Monthly close back below ~$780
The most likely scenario (bullish) targets $1000 and $1080, with a revert level at $940. The alternative scenario (bearish) targets $880 and $820.
All content on this website — including charts, analysis, price targets, support/resistance levels, and position zones — is generated entirely by AI and provided for educational and informational purposes only.
This is not financial advice. NEXUSNOIR VENTURES SL (the operator of this website) is not a registered investment adviser or broker-dealer. You should not make investment decisions based solely on this information. Always do your own research and consult a qualified financial advisor.
By continuing, you acknowledge that you have read and agree to our full disclaimer & terms of use and privacy policy.