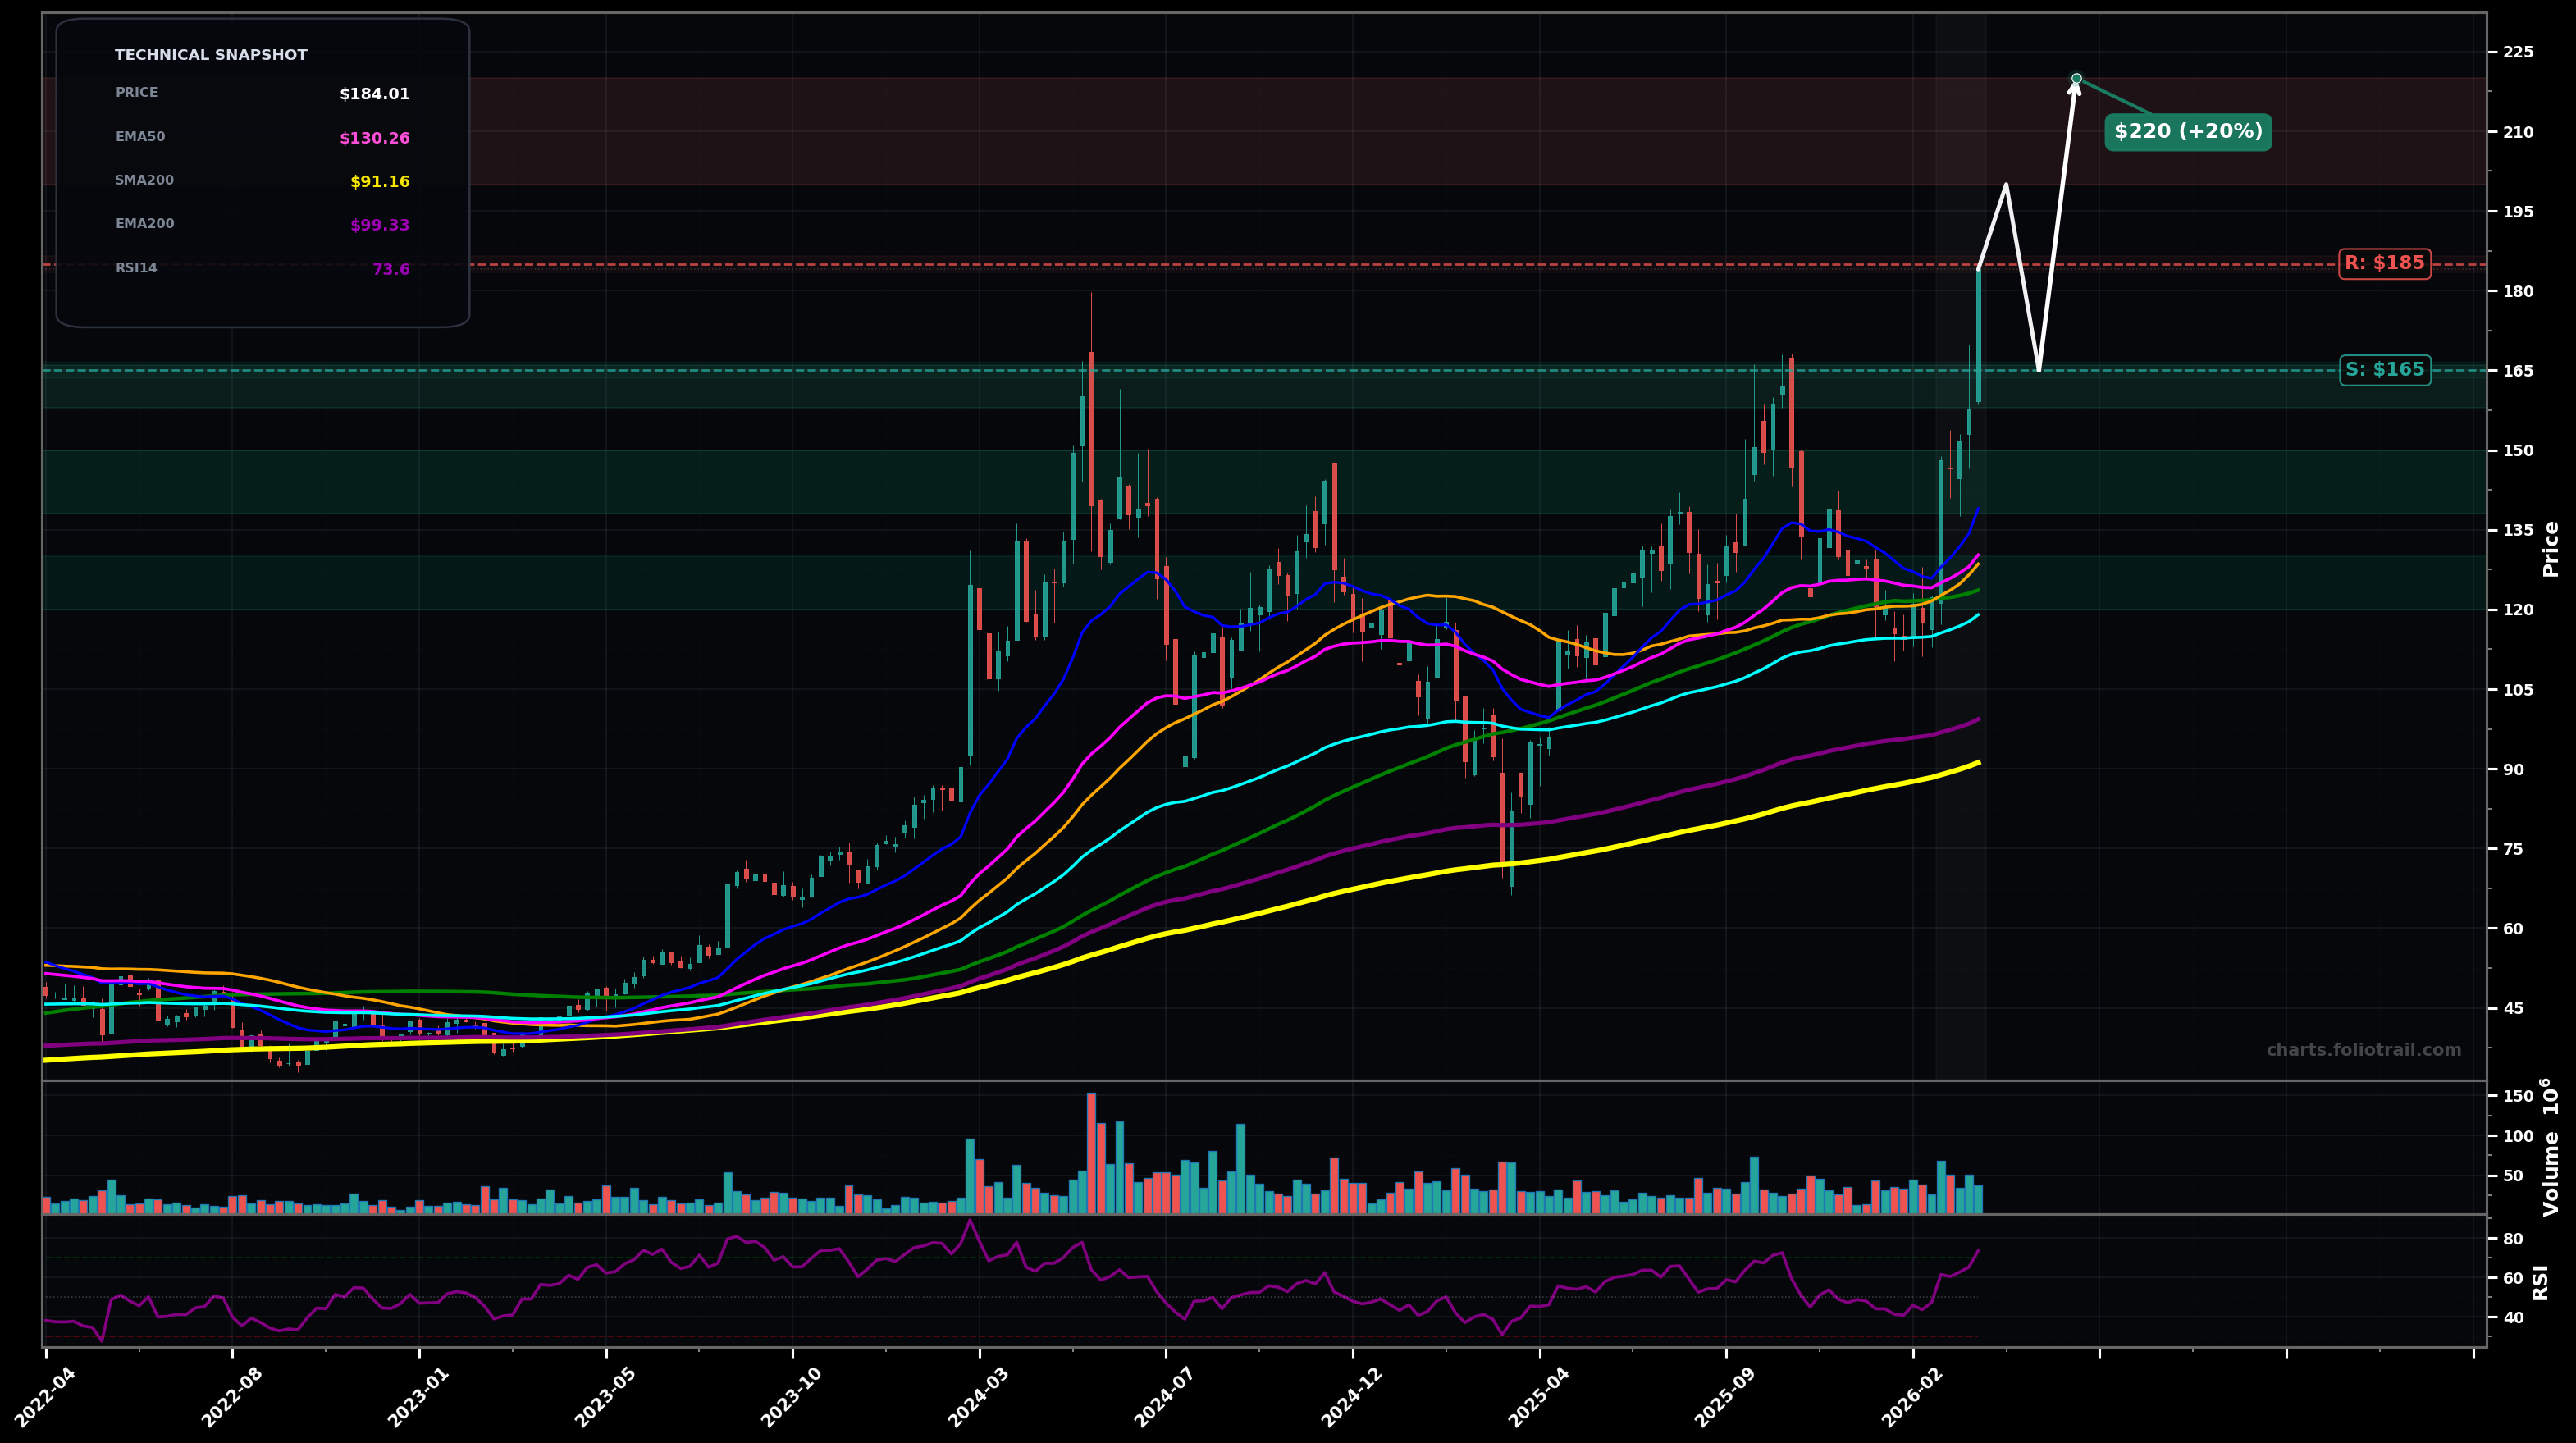
As of March 26, 2026, DELL (Dell Technologies Inc.) is in a parabolic state on the weekly chart, with a confidence level of 72%. Key support is at $165 and key resistance at $185. Weekly breakout to new highs with a strong continuation candle; price is extended above short/mid MAs and RSI is overbought.
Bullish continuation but with a likely pullback/throwback first; shallow retrace into the breakout area (prior highs) then attempt extension (Elliott: wave 5 extension / late-stage impulsive advance).
Momentum fade: overbought weekly condition triggers a deeper mean-reversion toward the rising EMA50/cluster; could be an ABC corrective wave after a completed 5-wave impulse from the 2025 swing low.
Hold above $165 on weekly closes (2+ closes) while making another HH above $184.
Weekly close below $150 (loss of breakout level and momentum).
Buy pullbacks to former resistance/round-number support ($165), add on deeper retrace toward $150, and heavy add near EMA50/SMA50 area (~$128–$130) if a weekly base forms.
Trim into upside extensions where price is increasingly stretched vs EMA50/EMA100; larger trims/exit if a blow-off move prints far above the MA stack (typical late-wave/overextension risk).
As of March 26, 2026, DELL (Dell Technologies Inc.) is in a parabolic state on the weekly chart with 72% confidence. Weekly breakout to new highs with a strong continuation candle; price is extended above short/mid MAs and RSI is overbought.
On the weekly timeframe, DELL has key support at $165 and key resistance at $185. The most likely scenario (bullish) targets $200 and $220, with a revert level at $165.
DELL (Dell Technologies Inc.) is currently classified as parabolic on the weekly chart, with 72% confidence. Confirmation requires: Hold above $165 on weekly closes (2+ closes) while making another HH above $184. This would be invalidated by: Weekly close below $150 (loss of breakout level and momentum).
The most likely scenario (bullish) targets $200 and $220, with a revert level at $165. The alternative scenario (bearish) targets $150 and $130.
Multi-layer AI agents analyse 200+ stocks across daily, weekly, and monthly timeframes — producing market state classifications, price scenarios with targets, and position entry/exit levels. Updated every trading day after market close. No paywall. No sign-up required.
Built by Foliotrail.
All content on this website — including charts, analysis, price targets, support/resistance levels, and position zones — is generated entirely by AI and provided for educational and informational purposes only.
This is not financial advice. NEXUSNOIR VENTURES SL (the operator of this website) is not a registered investment adviser or broker-dealer. You should not make investment decisions based solely on this information. Always do your own research and consult a qualified financial advisor.
By continuing, you acknowledge that you have read and agree to our full disclaimer & terms of use and privacy policy.