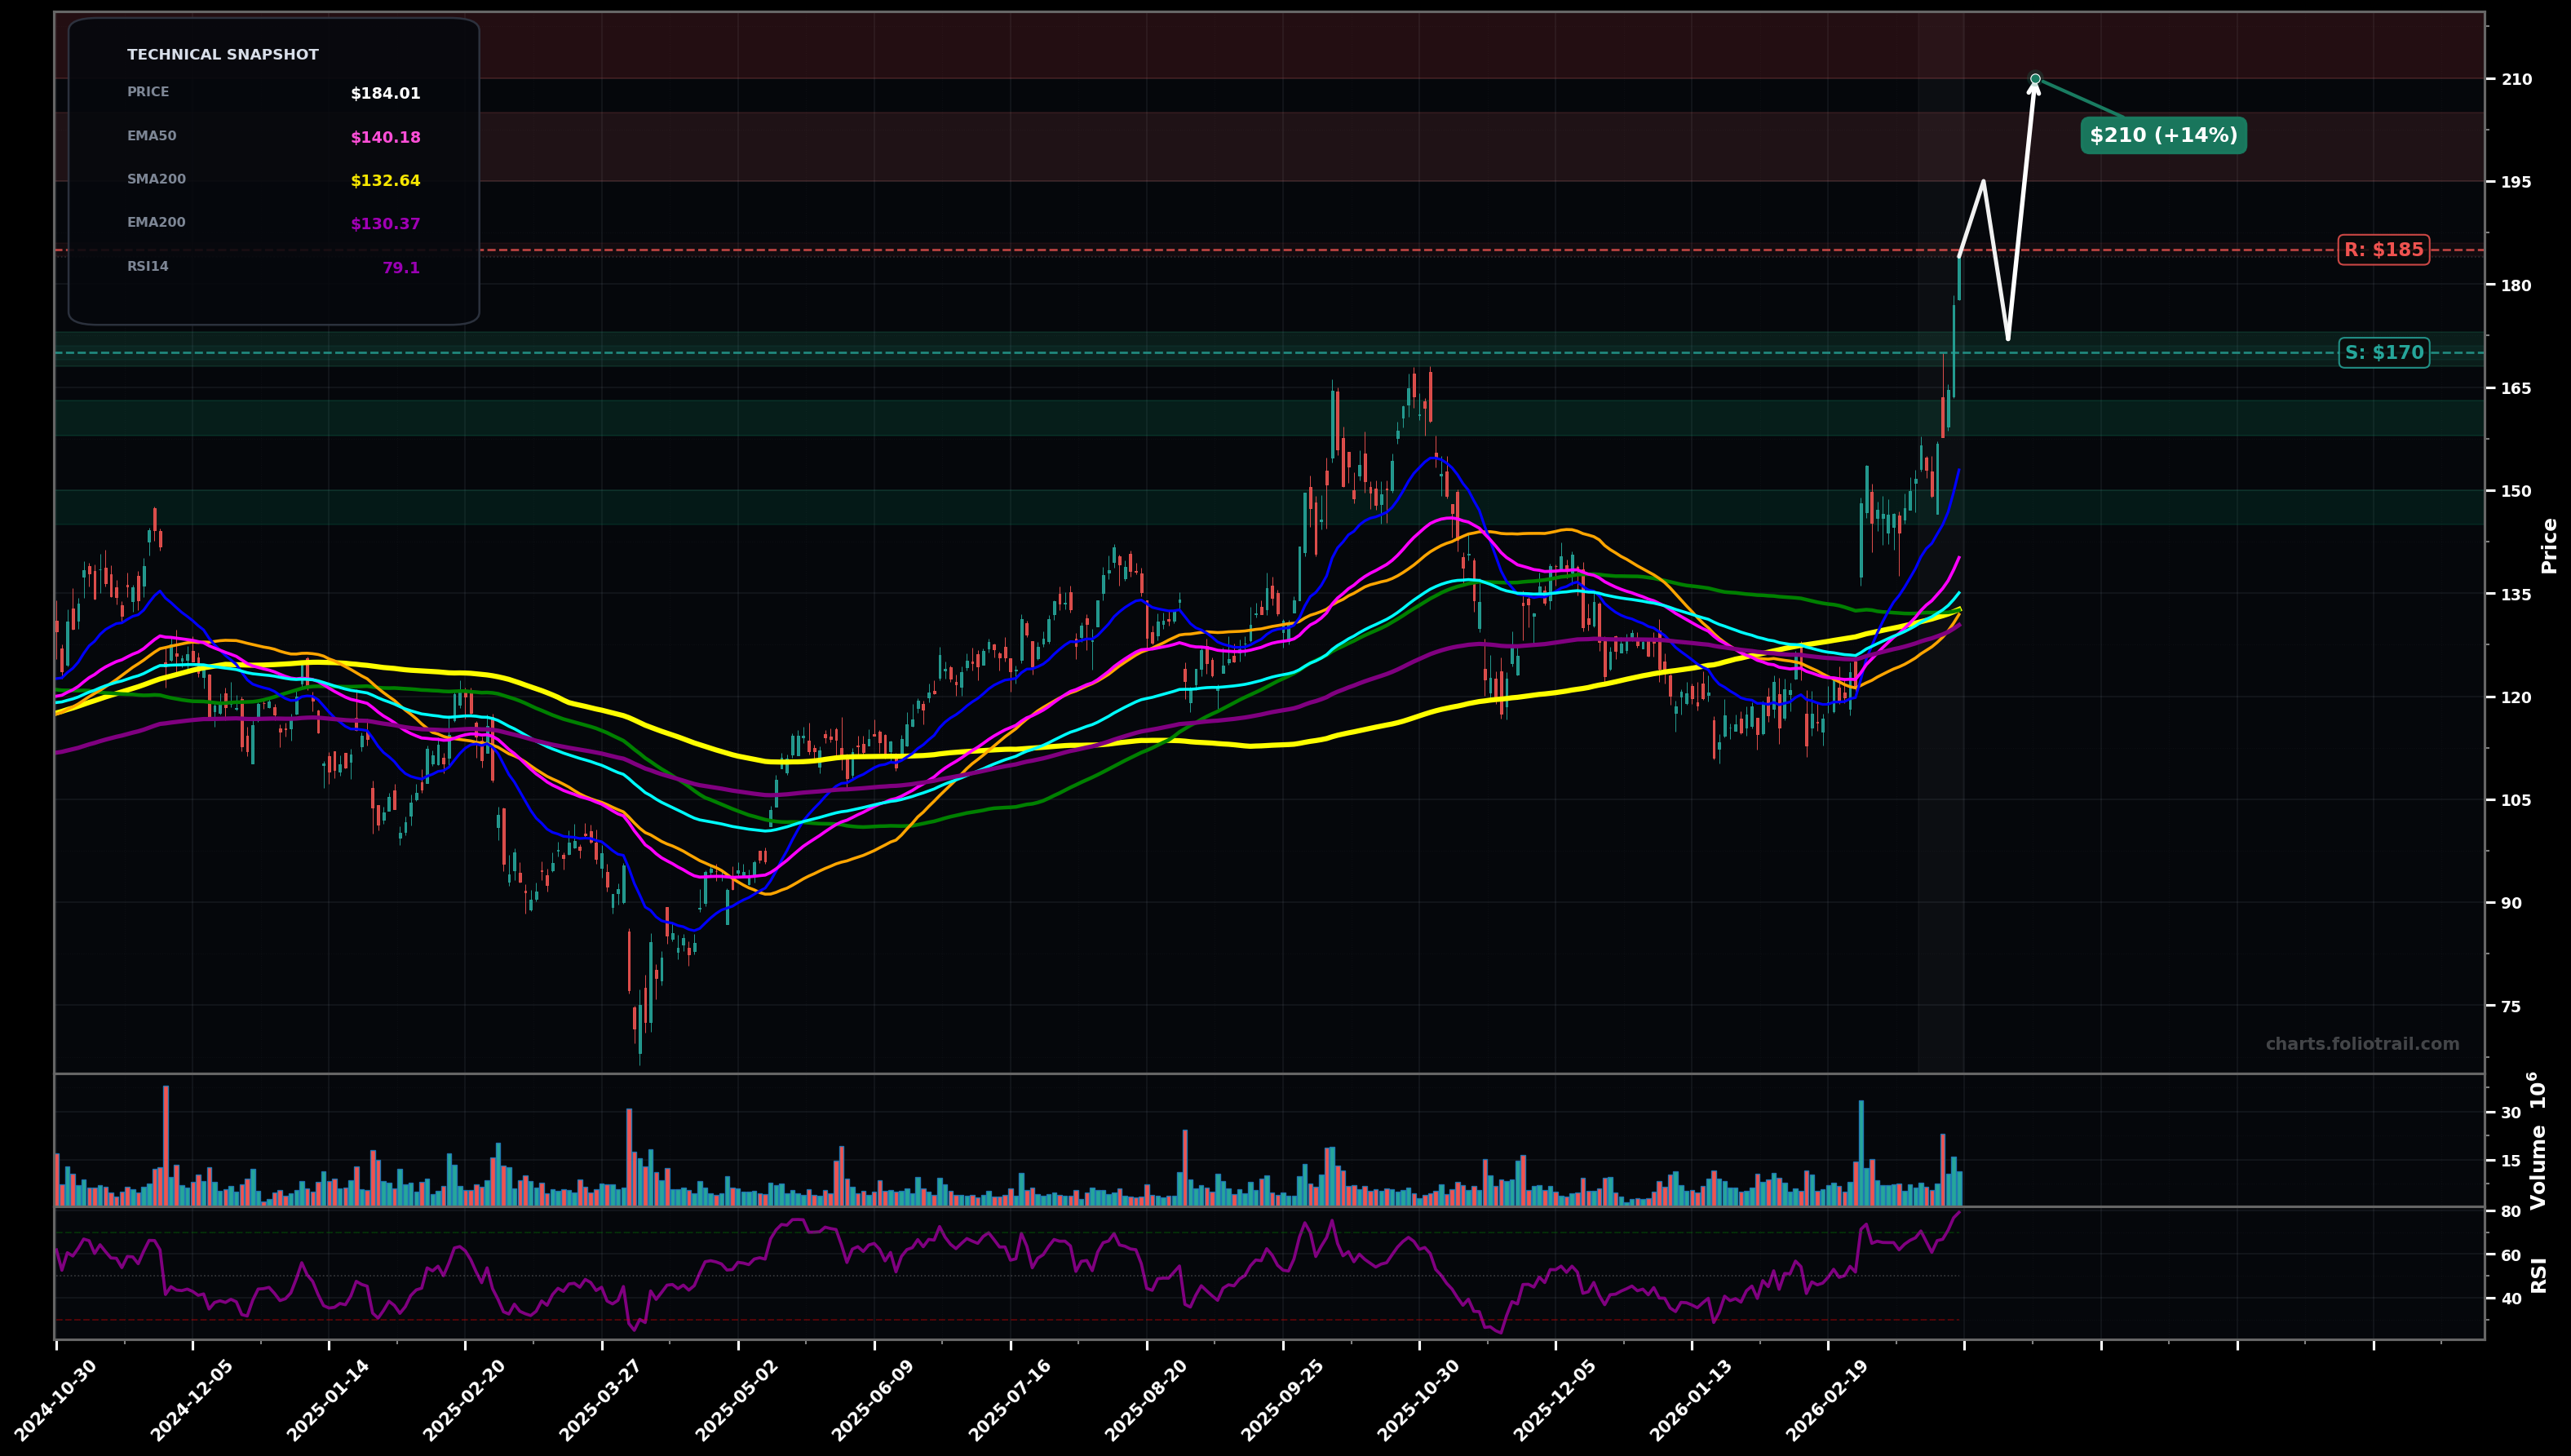
As of March 26, 2026, DELL (Dell Technologies Inc.) is in a parabolic state on the daily chart, with a confidence level of 72%. Key support is at $170 and key resistance at $185. Sharp upside breakout to new swing highs with expanding ranges; price stretched above rising EMA50/EMA100; RSI ~79 (overbought).
Bullish continuation (Elliott: late Wave 3 / Wave 5 extension) after a brief consolidation; upside probes continue while dips are bought above prior breakout area.
Mean-reversion pullback (Elliott: Wave 4 / post-impulse correction) as overbought conditions unwind; price rotates back toward the MA cluster / prior base before attempting a new leg.
Daily close above $185 with follow-through (another close above $185) while holding above $170
Daily close below $160 (breaks latest impulse structure and likely triggers mean reversion toward the MA cluster)
Start near breakout retest ($170) and prior swing area; add on deeper pullback to structure support (~$160); heavy add closer to rising EMA50 (~$140-$150) where Wave-4 style corrections often terminate.
Trim into extension targets (likely fib extensions of the prior swing) because price is already materially above EMA50/100 and RSI is overbought; higher zones assume further multiple-expansion risk and elevated reversal probability.
As of March 26, 2026, DELL (Dell Technologies Inc.) is in a parabolic state on the daily chart with 72% confidence. Sharp upside breakout to new swing highs with expanding ranges; price stretched above rising EMA50/EMA100; RSI ~79 (overbought).
On the daily timeframe, DELL has key support at $170 and key resistance at $185. The most likely scenario (bullish) targets $195 and $210, with a revert level at $172.
DELL (Dell Technologies Inc.) is currently classified as parabolic on the daily chart, with 72% confidence. Confirmation requires: Daily close above $185 with follow-through (another close above $185) while holding above $170 This would be invalidated by: Daily close below $160 (breaks latest impulse structure and likely triggers mean reversion toward the MA cluster)
The most likely scenario (bullish) targets $195 and $210, with a revert level at $172. The alternative scenario (bearish) targets $160 and $145.
Multi-layer AI agents analyse 200+ stocks across daily, weekly, and monthly timeframes — producing market state classifications, price scenarios with targets, and position entry/exit levels. Updated every trading day after market close. No paywall. No sign-up required.
Built by Foliotrail.
All content on this website — including charts, analysis, price targets, support/resistance levels, and position zones — is generated entirely by AI and provided for educational and informational purposes only.
This is not financial advice. NEXUSNOIR VENTURES SL (the operator of this website) is not a registered investment adviser or broker-dealer. You should not make investment decisions based solely on this information. Always do your own research and consult a qualified financial advisor.
By continuing, you acknowledge that you have read and agree to our full disclaimer & terms of use and privacy policy.