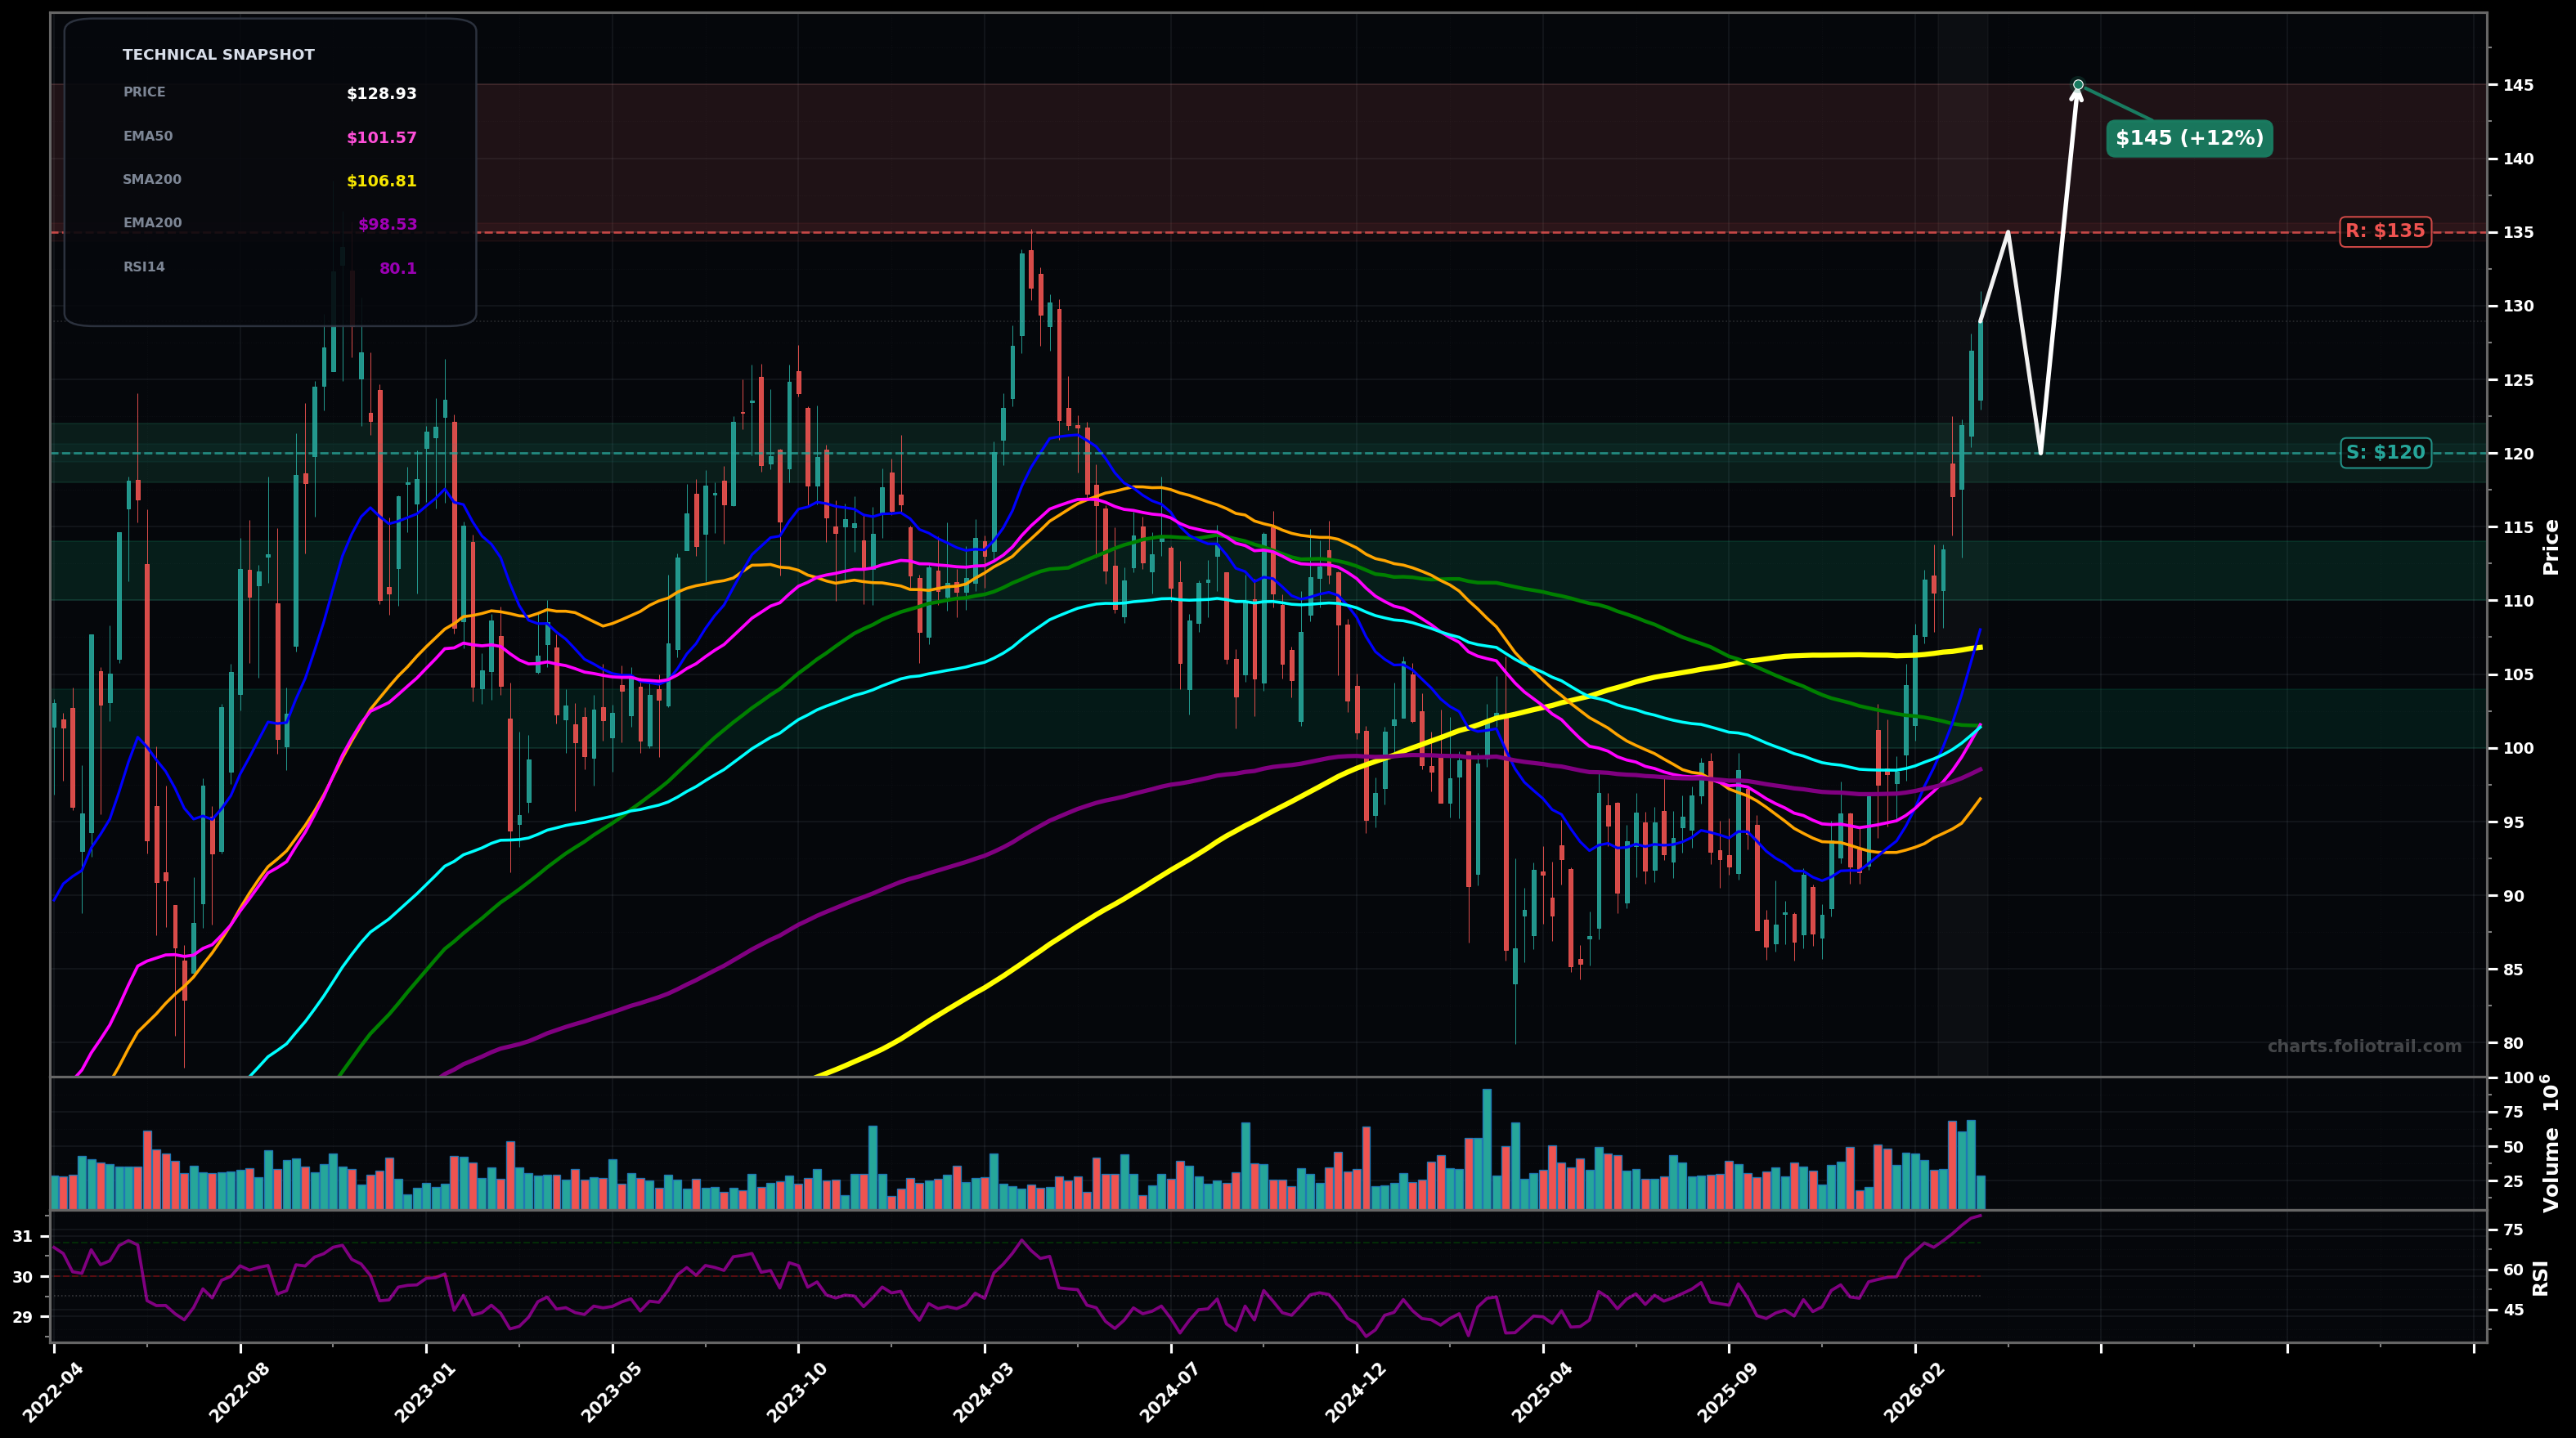
As of March 26, 2026, COP (ConocoPhillips) is in a parabolic state on the weekly chart, with a confidence level of 72%. Key support is at $120 and key resistance at $135. Strong weekly breakout/rally to ~$128.93 with expanding volatility; price is extended above key MAs and RSI is overbought (~80).
Momentum continues but starts to stair-step: brief consolidation/pullback to the breakout area, then a push toward prior supply near the $135 zone (Elliott: late Wave 5 extension with risk of sharp Wave A pullback).
Blow-off to a marginal new high then mean-reversion: price rejects near $135 and retraces toward the MA cluster (EMA50/EMA100 around ~$101–$101) with a deeper fib-style pullback before attempting a new base (Elliott: Wave 5 top -> ABC correction).
Weekly close above $131 (follow-through to new HH) while holding above $120
Weekly close back below $110 (loss of reclaimed MA cluster/failed breakout)
Buy interest is best on pullbacks: $120 is the breakout/round-number support, $112 is the next swing/structure shelf, and $100–$104 aligns with the heavy MA cluster (EMA50/100 + SMA100 region) for higher R:R.
With RSI overbought and price far above long MAs, trim into extensions (likely Wave-5 territory) where upside becomes asymmetrically smaller vs drawdown risk from an ABC mean-reversion.
As of March 26, 2026, COP (ConocoPhillips) is in a parabolic state on the weekly chart with 72% confidence. Strong weekly breakout/rally to ~$128.93 with expanding volatility; price is extended above key MAs and RSI is overbought (~80).
On the weekly timeframe, COP has key support at $120 and key resistance at $135. The most likely scenario (bullish) targets $135 and $145, with a revert level at $120.
COP (ConocoPhillips) is currently classified as parabolic on the weekly chart, with 72% confidence. Confirmation requires: Weekly close above $131 (follow-through to new HH) while holding above $120 This would be invalidated by: Weekly close back below $110 (loss of reclaimed MA cluster/failed breakout)
The most likely scenario (bullish) targets $135 and $145, with a revert level at $120. The alternative scenario (bearish) targets $112 and $102.
Multi-layer AI agents analyse 200+ stocks across daily, weekly, and monthly timeframes — producing market state classifications, price scenarios with targets, and position entry/exit levels. Updated every trading day after market close. No paywall. No sign-up required.
Built by Foliotrail.
All content on this website — including charts, analysis, price targets, support/resistance levels, and position zones — is generated entirely by AI and provided for educational and informational purposes only.
This is not financial advice. NEXUSNOIR VENTURES SL (the operator of this website) is not a registered investment adviser or broker-dealer. You should not make investment decisions based solely on this information. Always do your own research and consult a qualified financial advisor.
By continuing, you acknowledge that you have read and agree to our full disclaimer & terms of use and privacy policy.