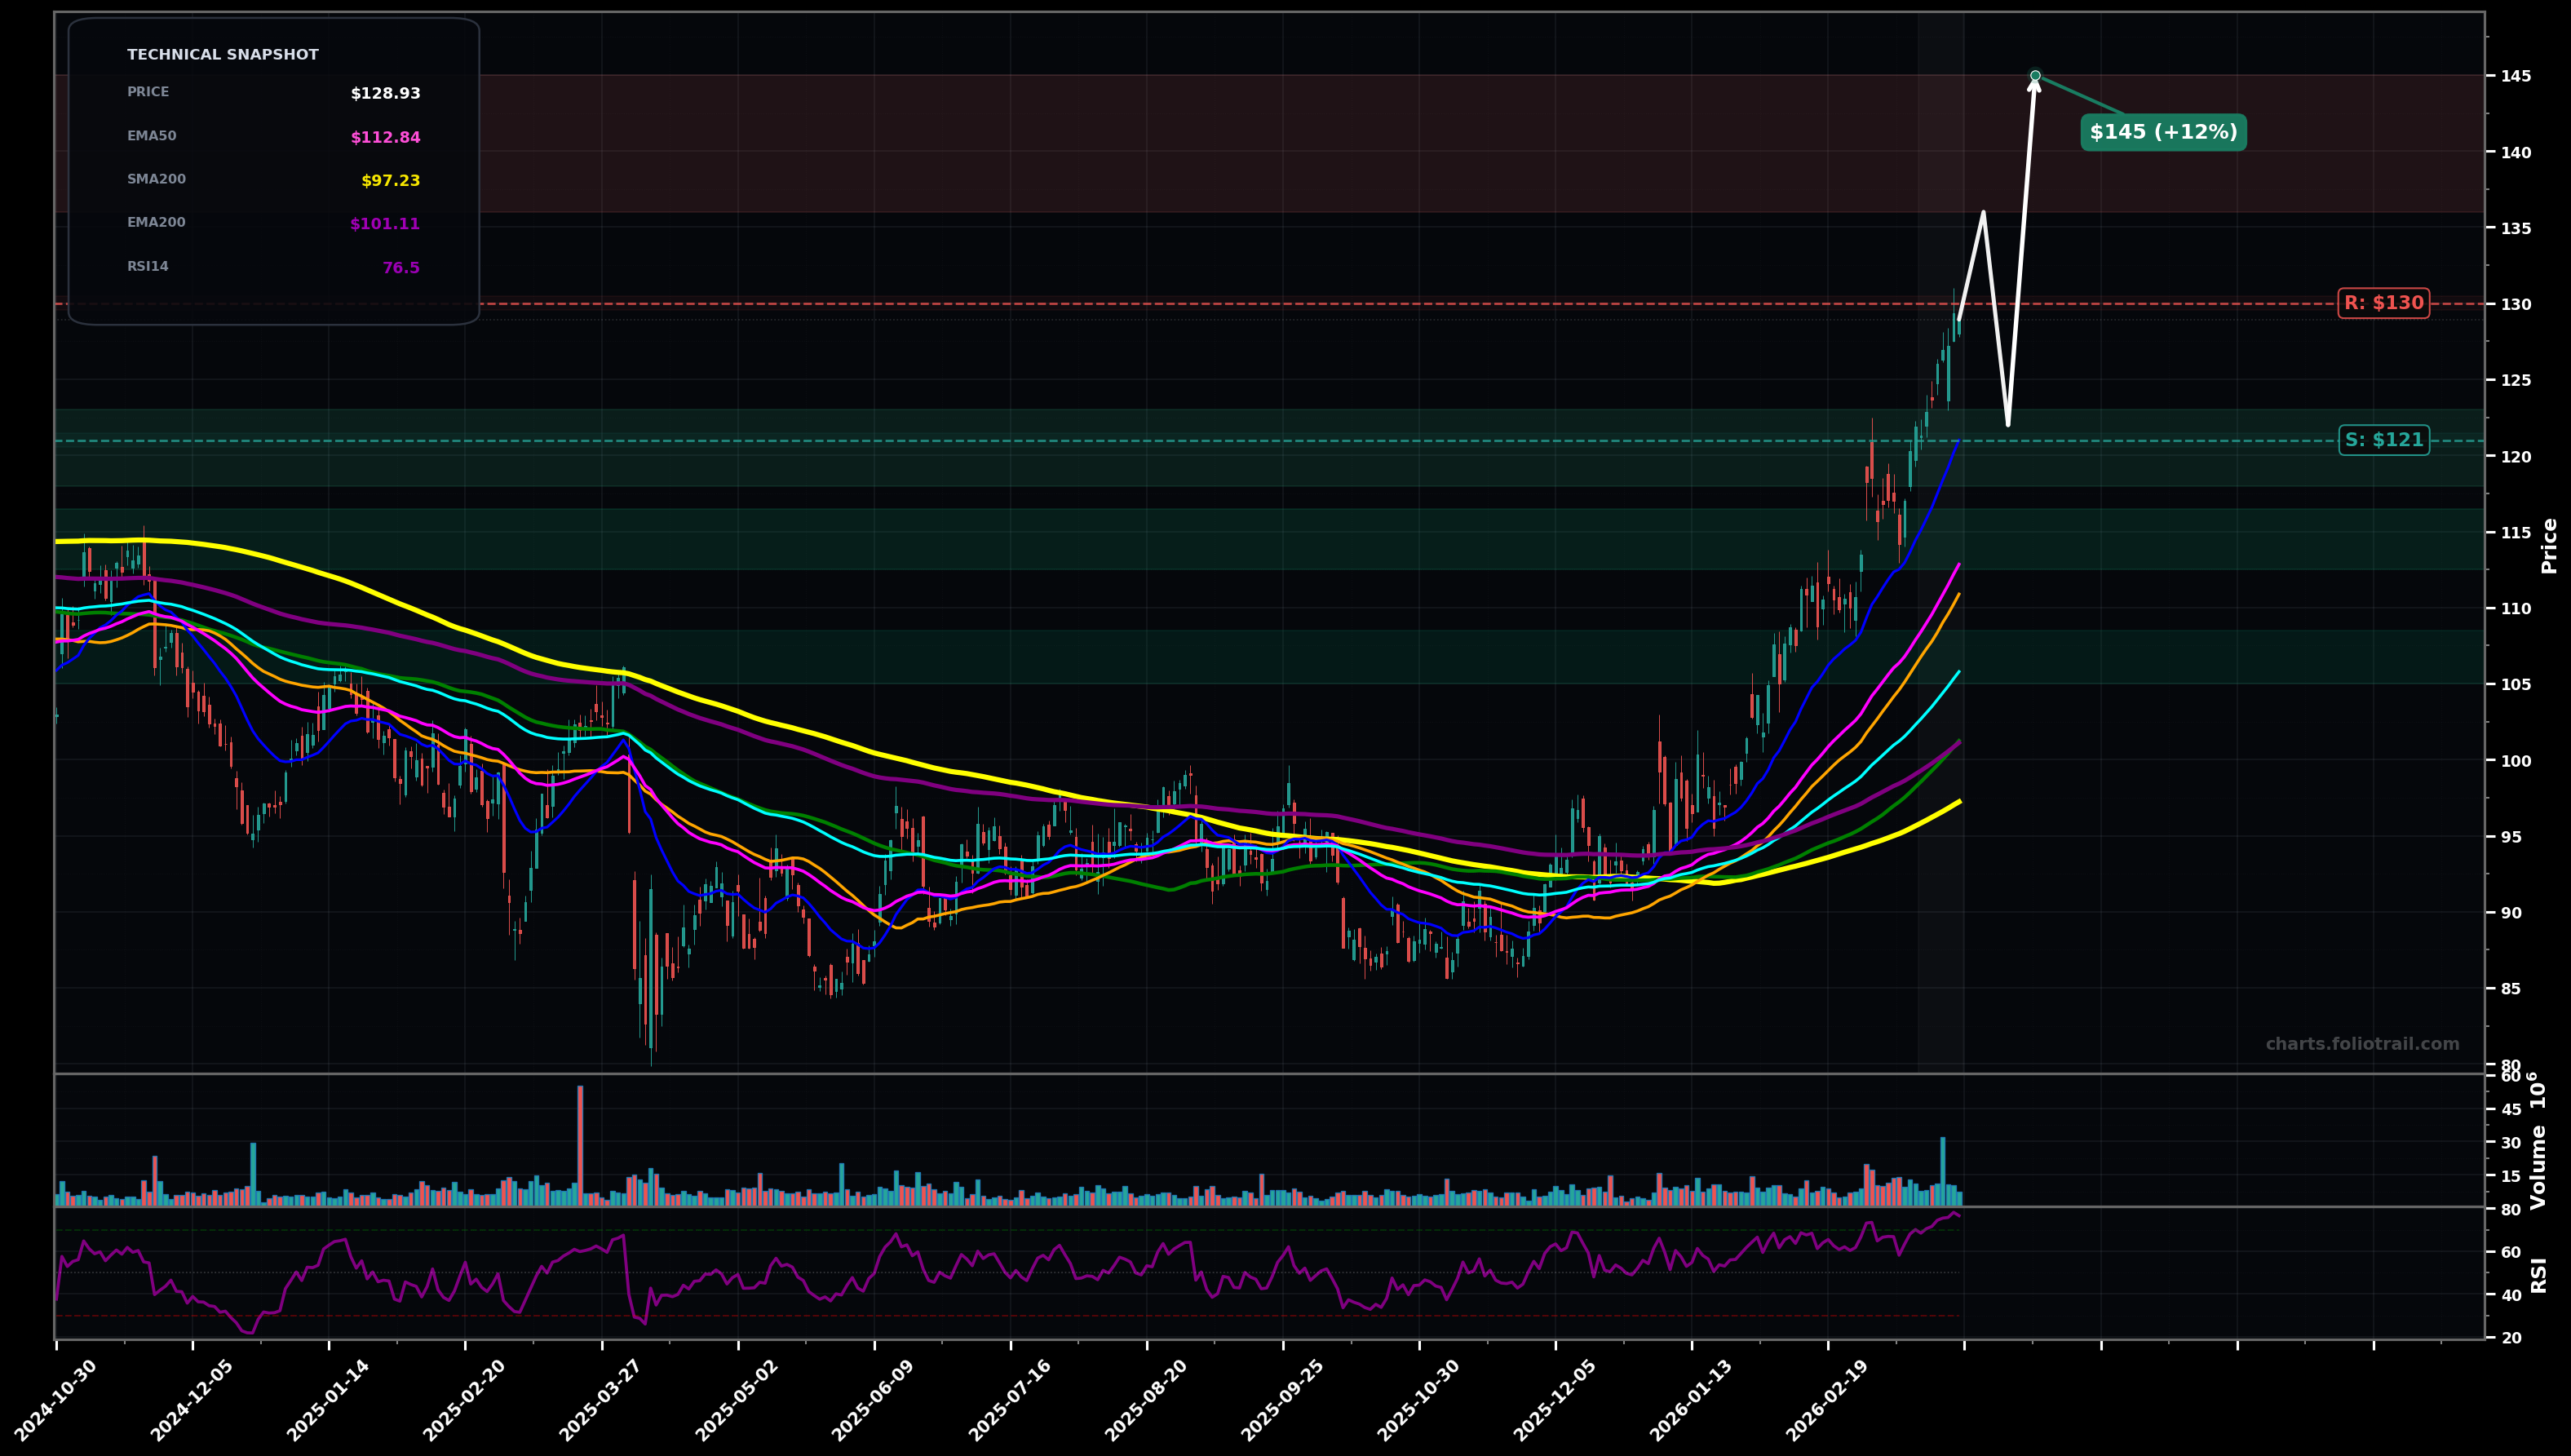
As of March 26, 2026, COP (ConocoPhillips) is in a parabolic state on the daily chart, with a confidence level of 72%. Key support is at $121 and key resistance at $130. Strong HH/HL advance with price at new swing highs and stretched above fast/medium MAs; RSI elevated (~76).
Bullish continuation: brief consolidation/pullback to the $121-$123 area, then trend resumes to a measured extension; Elliott view: late Wave 5 extension, so upside continues but with rising reversal risk.
Bearish mean-reversion: momentum exhausts and price retraces toward the prior breakout zone and rising EMA50; Elliott view: Wave 5 top forms then an A-B-C correction toward fib retracement of the last impulse.
2+ daily closes above $129.50 with pullbacks holding above $121.00 (EMA20 area).
Daily close below $112.80 (EMA50) would break the steep trend and shift to a deeper correction.
Buy interest staged at EMA20/previous breakout ($118-$123), then EMA50 ($112-$116), then EMA100 confluence ($105-$109) if a deeper A-B-C plays out.
Trim into fib-extension/momentum stretch zones above prior highs; higher bands assume continued Wave-5 extension before a larger-cycle correction risk rises.
As of March 26, 2026, COP (ConocoPhillips) is in a parabolic state on the daily chart with 72% confidence. Strong HH/HL advance with price at new swing highs and stretched above fast/medium MAs; RSI elevated (~76).
On the daily timeframe, COP has key support at $121 and key resistance at $130. The most likely scenario (bullish) targets $136 and $145, with a revert level at $122.
COP (ConocoPhillips) is currently classified as parabolic on the daily chart, with 72% confidence. Confirmation requires: 2+ daily closes above $129.50 with pullbacks holding above $121.00 (EMA20 area). This would be invalidated by: Daily close below $112.80 (EMA50) would break the steep trend and shift to a deeper correction.
The most likely scenario (bullish) targets $136 and $145, with a revert level at $122. The alternative scenario (bearish) targets $113 and $106.
Multi-layer AI agents analyse 200+ stocks across daily, weekly, and monthly timeframes — producing market state classifications, price scenarios with targets, and position entry/exit levels. Updated every trading day after market close. No paywall. No sign-up required.
Built by Foliotrail.
All content on this website — including charts, analysis, price targets, support/resistance levels, and position zones — is generated entirely by AI and provided for educational and informational purposes only.
This is not financial advice. NEXUSNOIR VENTURES SL (the operator of this website) is not a registered investment adviser or broker-dealer. You should not make investment decisions based solely on this information. Always do your own research and consult a qualified financial advisor.
By continuing, you acknowledge that you have read and agree to our full disclaimer & terms of use and privacy policy.