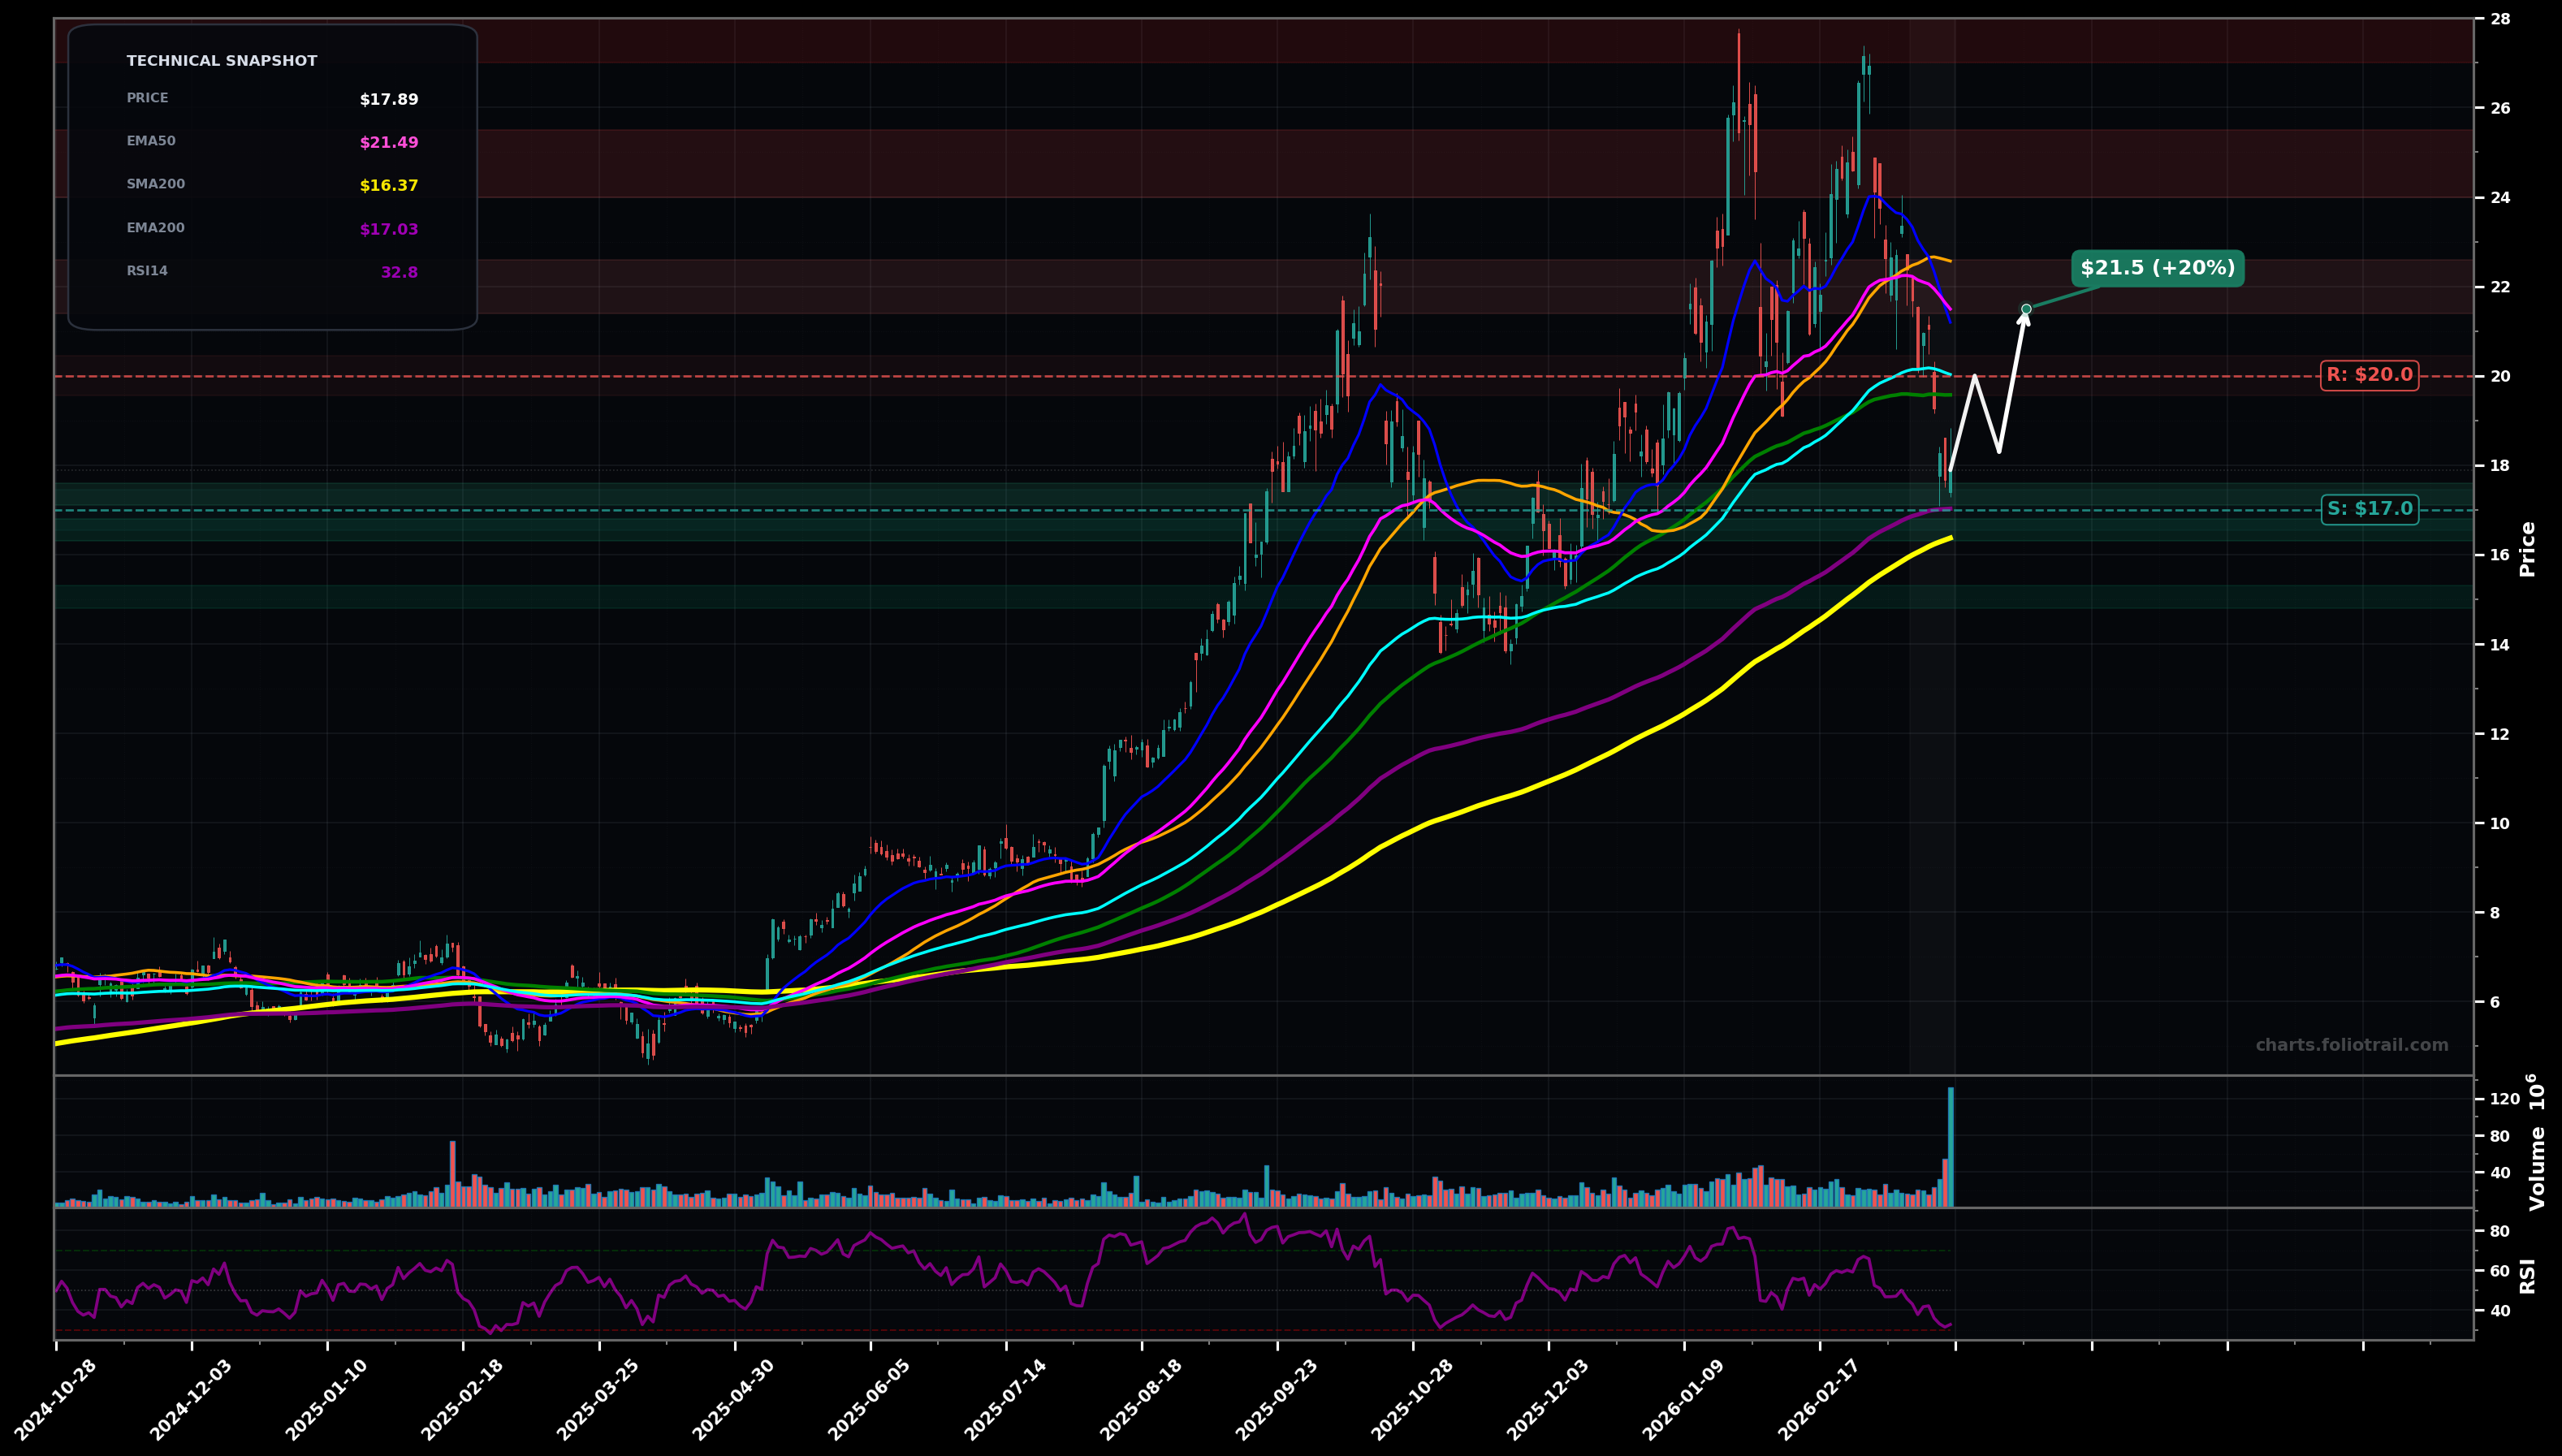
As of March 24, 2026, CDE (Coeur Mining, Inc.) is in a downtrend state on the daily chart, with a confidence level of 72%. Key support is at $17.0 and key resistance at $20.0. Sharp selloff to $17.89 with RSI14 ~32.8; price broke below EMA50/EMA100 and is testing the EMA200 (~$17.03) after a failed bounce from the $20-$22 area.
Base attempt at/just above EMA200 (~$17) followed by a relief rally back into the $20-$21 area (EMA100/overhead supply); likely choppy if it stalls under $21.50.
Breakdown through EMA200 (~$17) triggers a flush toward the next demand zone near prior consolidation and the rising SMA200 (~$16.37), with risk of an overshoot to ~$15 if selling accelerates.
Daily close below $17.00 (loss of EMA200) would confirm a deeper downtrend leg
Two daily closes back above $20.10 (reclaim EMA100 area) would invalidate the immediate downtrend pressure
Scale near EMA200/SMA200 confluence ($17-$16) where bounces often start; heavy add only on capitulation/overshoot toward ~$15 support to improve average if trend breaks lower.
Trim into overhead MA supply (EMA50/SMA50 zone ~$21-$23), trim more into prior distribution ($24-$25.5), and exit near the prior major top resistance ($27-$28) where Wave-5/extension risk is highest.
As of March 24, 2026, CDE (Coeur Mining, Inc.) is in a downtrend state on the daily chart with 72% confidence. Sharp selloff to $17.89 with RSI14 ~32.8; price broke below EMA50/EMA100 and is testing the EMA200 (~$17.03) after a failed bounce from the $20-$22 area.
On the daily timeframe, CDE has key support at $17.0 and key resistance at $20.0. The most likely scenario (bullish) targets $20.0 and $21.5, with a revert level at $18.3.
CDE (Coeur Mining, Inc.) is currently classified as downtrend on the daily chart, with 72% confidence. Confirmation requires: Daily close below $17.00 (loss of EMA200) would confirm a deeper downtrend leg This would be invalidated by: Two daily closes back above $20.10 (reclaim EMA100 area) would invalidate the immediate downtrend pressure
The most likely scenario (bullish) targets $20.0 and $21.5, with a revert level at $18.3. The alternative scenario (bearish) targets $16.4 and $15.0.
All content on this website — including charts, analysis, price targets, support/resistance levels, and position zones — is generated entirely by AI and provided for educational and informational purposes only.
This is not financial advice. NEXUSNOIR VENTURES SL (the operator of this website) is not a registered investment adviser or broker-dealer. You should not make investment decisions based solely on this information. Always do your own research and consult a qualified financial advisor.
By continuing, you acknowledge that you have read and agree to our full disclaimer & terms of use and privacy policy.