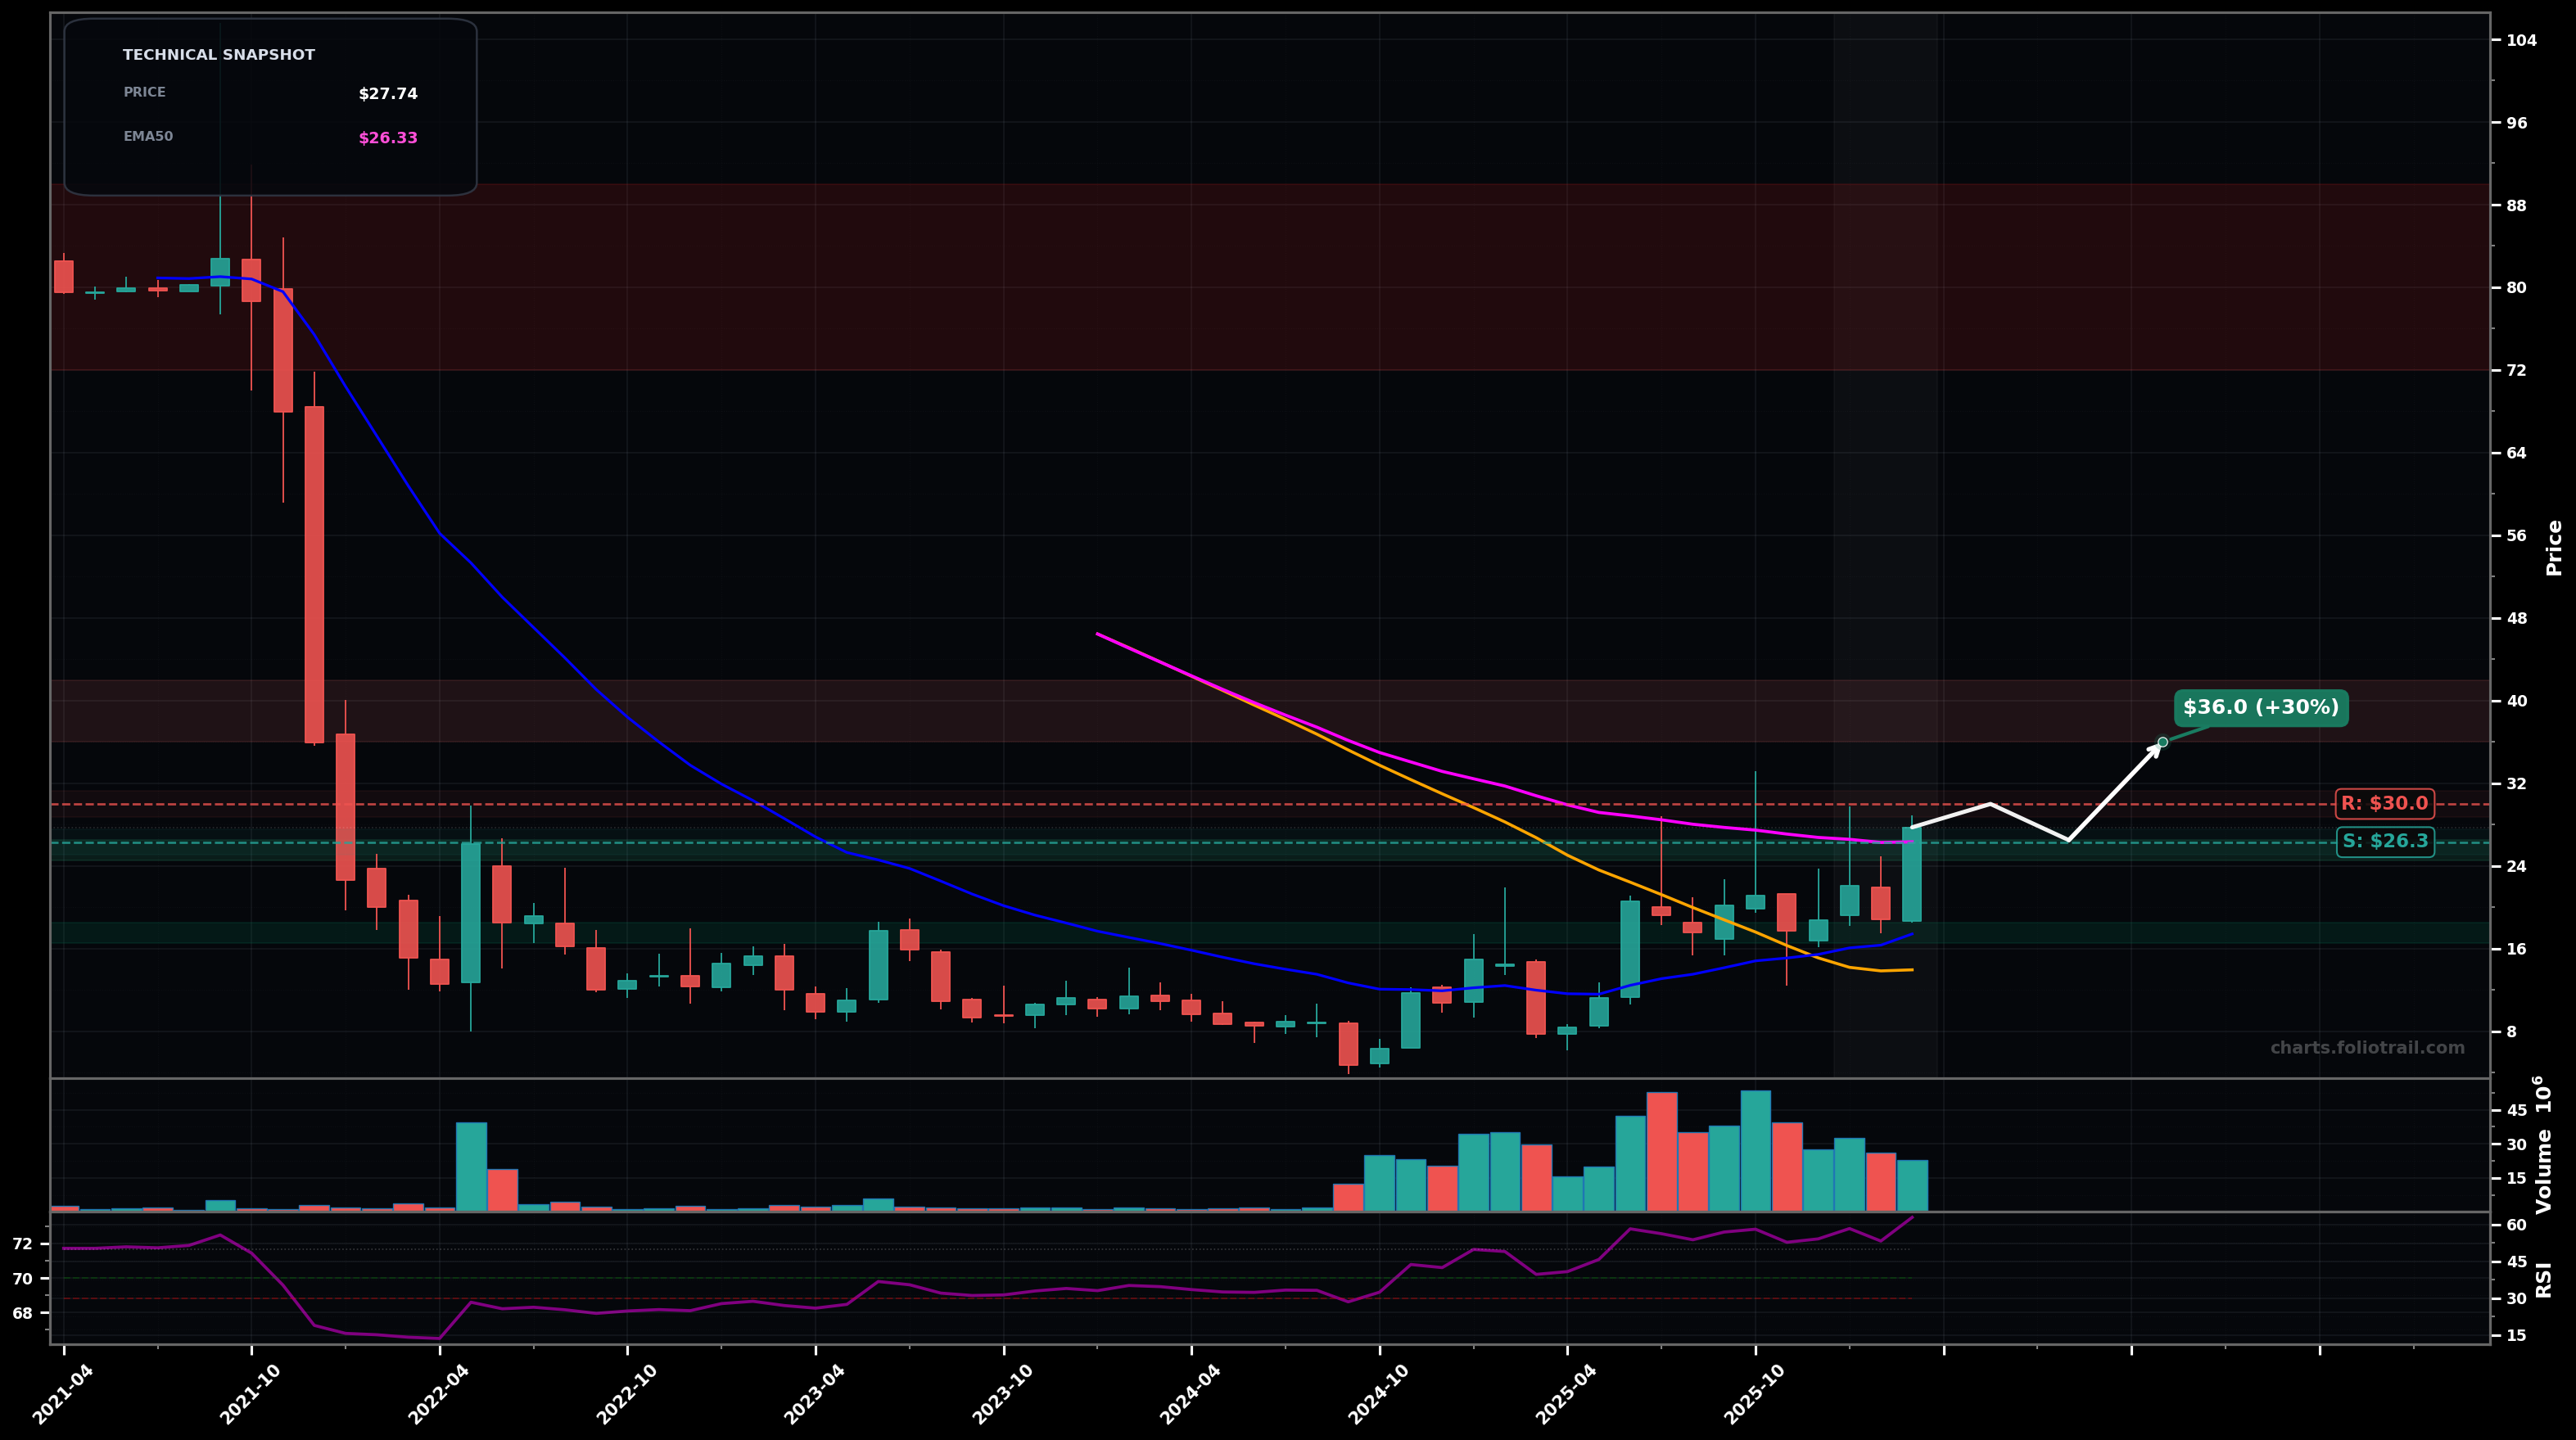
As of March 24, 2026, BKSY (BlackSky Technology Inc.) is in a breakout reversal state on the monthly chart, with a confidence level of 68%. Key support is at $26.3 and key resistance at $30.0. Monthly breakout impulse to ~$27.74 with rising volume; price reclaimed and is holding above EMA50 (pink ~$26.33) and above the rising EMA20 (~$17.42); RSI14 ~62.8 (bullish momentum, not extreme).
Bullish continuation: brief consolidation/pullback holds the $26s (EMA50 retest), then push through ~$30 and grind higher toward prior supply zones. (Prob ~60%)
Bearish rejection: fails at ~$30, loses EMA50, and mean-reverts toward the rising EMA20/previous breakout base. (Prob ~40%)
Monthly close above $30.00 (and holding above EMA50 ~$26.33) confirms breakout continuation.
Monthly close below $24.00 (back below reclaimed breakout area/EMA50 zone) invalidates the breakout-reversal posture.
Start on EMA50/pivot support retest; add on deeper pullback into prior base; heavy add near EMA20/major base support where reversal structure would likely be defended.
Trim into major overhead supply/Fibonacci extension zones as price stretches far above rising MAs; progressively de-risk as extensions approach prior distribution area and full-cycle upside extremes.
As of March 24, 2026, BKSY (BlackSky Technology Inc.) is in a breakout reversal state on the monthly chart with 68% confidence. Monthly breakout impulse to ~$27.74 with rising volume; price reclaimed and is holding above EMA50 (pink ~$26.33) and above the rising EMA20 (~$17.42); RSI14 ~62.8 (bullish momentum, not extreme).
On the monthly timeframe, BKSY has key support at $26.3 and key resistance at $30.0. The most likely scenario (bullish) targets $30.0 and $36.0, with a revert level at $26.5.
BKSY (BlackSky Technology Inc.) is currently classified as breakout reversal on the monthly chart, with 68% confidence. Confirmation requires: Monthly close above $30.00 (and holding above EMA50 ~$26.33) confirms breakout continuation. This would be invalidated by: Monthly close below $24.00 (back below reclaimed breakout area/EMA50 zone) invalidates the breakout-reversal posture.
The most likely scenario (bullish) targets $30.0 and $36.0, with a revert level at $26.5. The alternative scenario (bearish) targets $24.0 and $17.5.
All content on this website — including charts, analysis, price targets, support/resistance levels, and position zones — is generated entirely by AI and provided for educational and informational purposes only.
This is not financial advice. NEXUSNOIR VENTURES SL (the operator of this website) is not a registered investment adviser or broker-dealer. You should not make investment decisions based solely on this information. Always do your own research and consult a qualified financial advisor.
By continuing, you acknowledge that you have read and agree to our full disclaimer & terms of use and privacy policy.