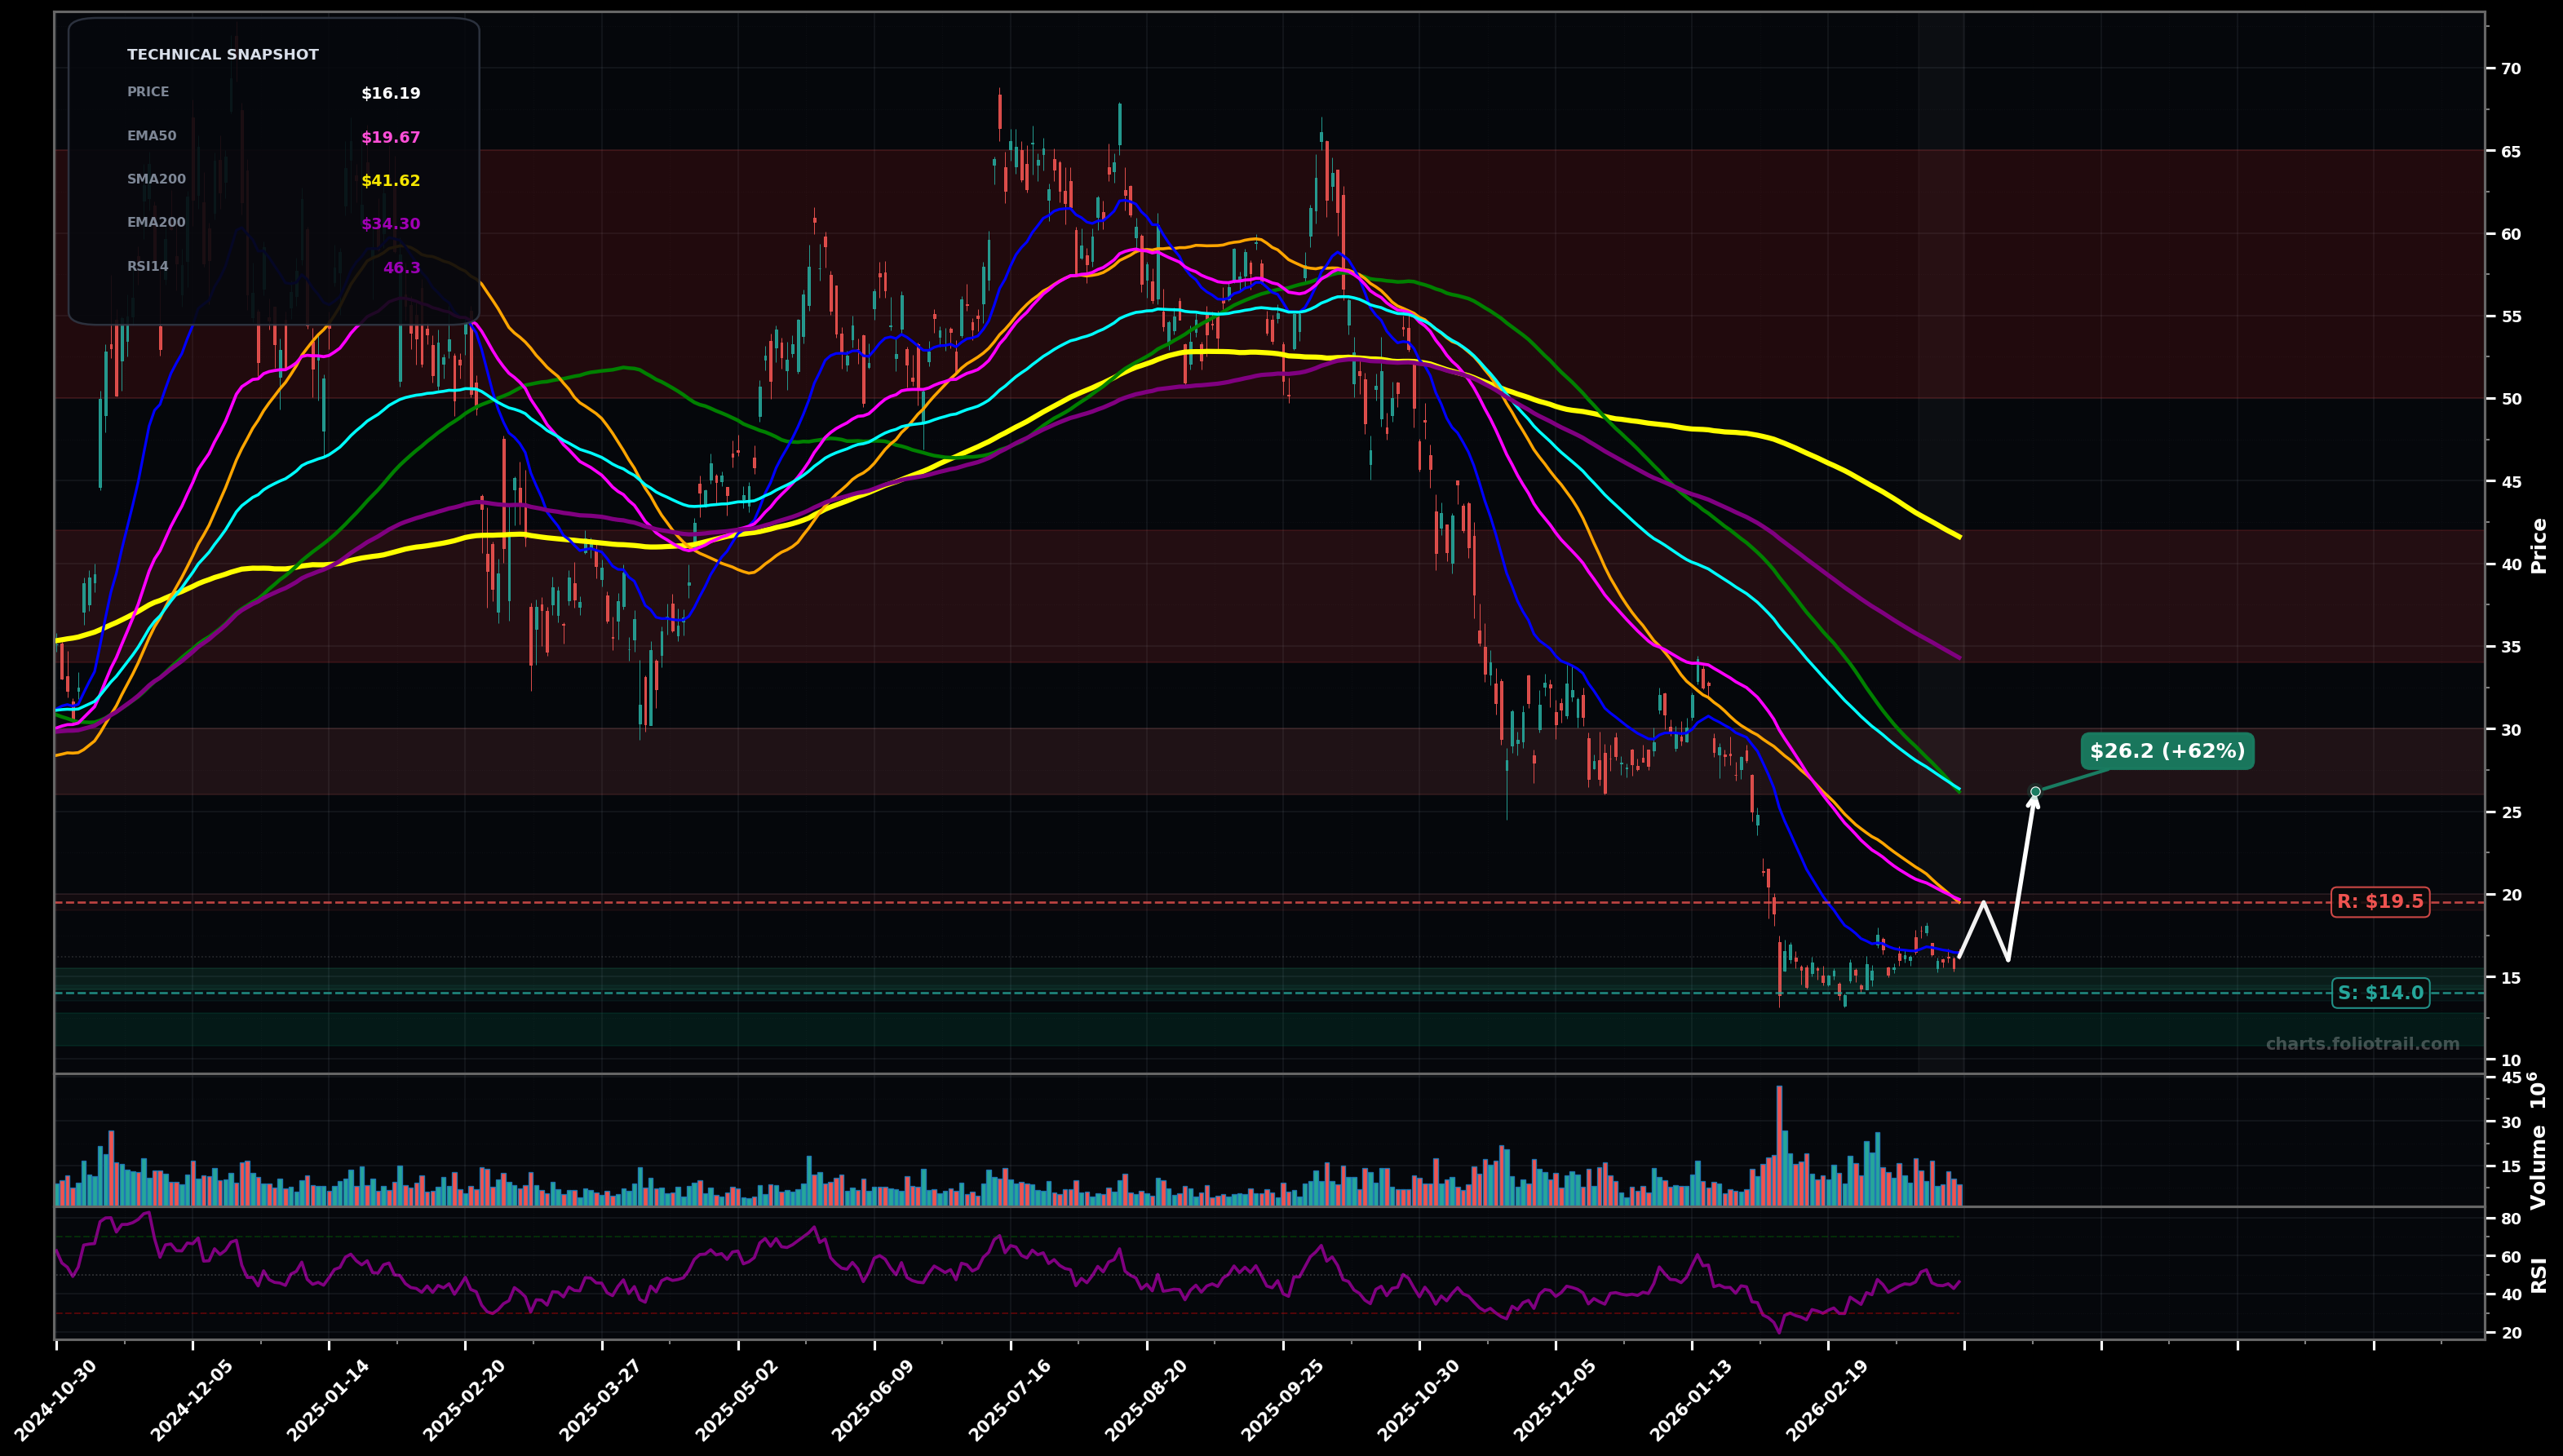
As of March 26, 2026, BITX (2X BITCOIN STRATEGY ETF) is in a bottoming attempt state on the daily chart, with a confidence level of 58%. Key support is at $14.0 and key resistance at $19.5. Sharp multi-month selloff into ~$14–$15, then a small rebound and tight consolidation; price ~$16.19 still below all key MAs with RSI ~46 (bear-market bounce).
Base holds above ~$14 and price grinds up into a relief rally toward the first overhead MA cluster (EMA50/SMA50 area), with a likely pullback/retest before a second push.
Support fails and the downtrend resumes (wave-5 style continuation), with volatility expanding and another flush before stabilization.
Daily close(s) above ~$19.50 (reclaim/hold above SMA50 ~$19.49 area) would confirm a breakout-reversal attempt
Daily close below ~$14.00 would invalidate the base and re-open the downtrend
Accumulation zones are anchored to the swing-low/base shelf (~$14) and a fib-style downside extension area if the base breaks; size up only if price stabilizes after a flush.
Trim into the next major overhead supply/MA stacks (SMA100~$26, EMA200~$34, SMA200~$42) and close into prior distribution zone highs where mean-reversion risk is highest.
As of March 26, 2026, BITX (2X BITCOIN STRATEGY ETF) is in a bottoming attempt state on the daily chart with 58% confidence. Sharp multi-month selloff into ~$14–$15, then a small rebound and tight consolidation; price ~$16.19 still below all key MAs with RSI ~46 (bear-market bounce).
On the daily timeframe, BITX has key support at $14.0 and key resistance at $19.5. The most likely scenario (bullish) targets $19.5 and $26.2, with a revert level at $16.0.
BITX (2X BITCOIN STRATEGY ETF) is currently classified as bottoming attempt on the daily chart, with 58% confidence. Confirmation requires: Daily close(s) above ~$19.50 (reclaim/hold above SMA50 ~$19.49 area) would confirm a breakout-reversal attempt This would be invalidated by: Daily close below ~$14.00 would invalidate the base and re-open the downtrend
The most likely scenario (bullish) targets $19.5 and $26.2, with a revert level at $16.0. The alternative scenario (bearish) targets $14.0 and $11.5.
Multi-layer AI agents analyse 200+ stocks across daily, weekly, and monthly timeframes — producing market state classifications, price scenarios with targets, and position entry/exit levels. Updated every trading day after market close. No paywall. No sign-up required.
Built by Foliotrail.
All content on this website — including charts, analysis, price targets, support/resistance levels, and position zones — is generated entirely by AI and provided for educational and informational purposes only.
This is not financial advice. NEXUSNOIR VENTURES SL (the operator of this website) is not a registered investment adviser or broker-dealer. You should not make investment decisions based solely on this information. Always do your own research and consult a qualified financial advisor.
By continuing, you acknowledge that you have read and agree to our full disclaimer & terms of use and privacy policy.