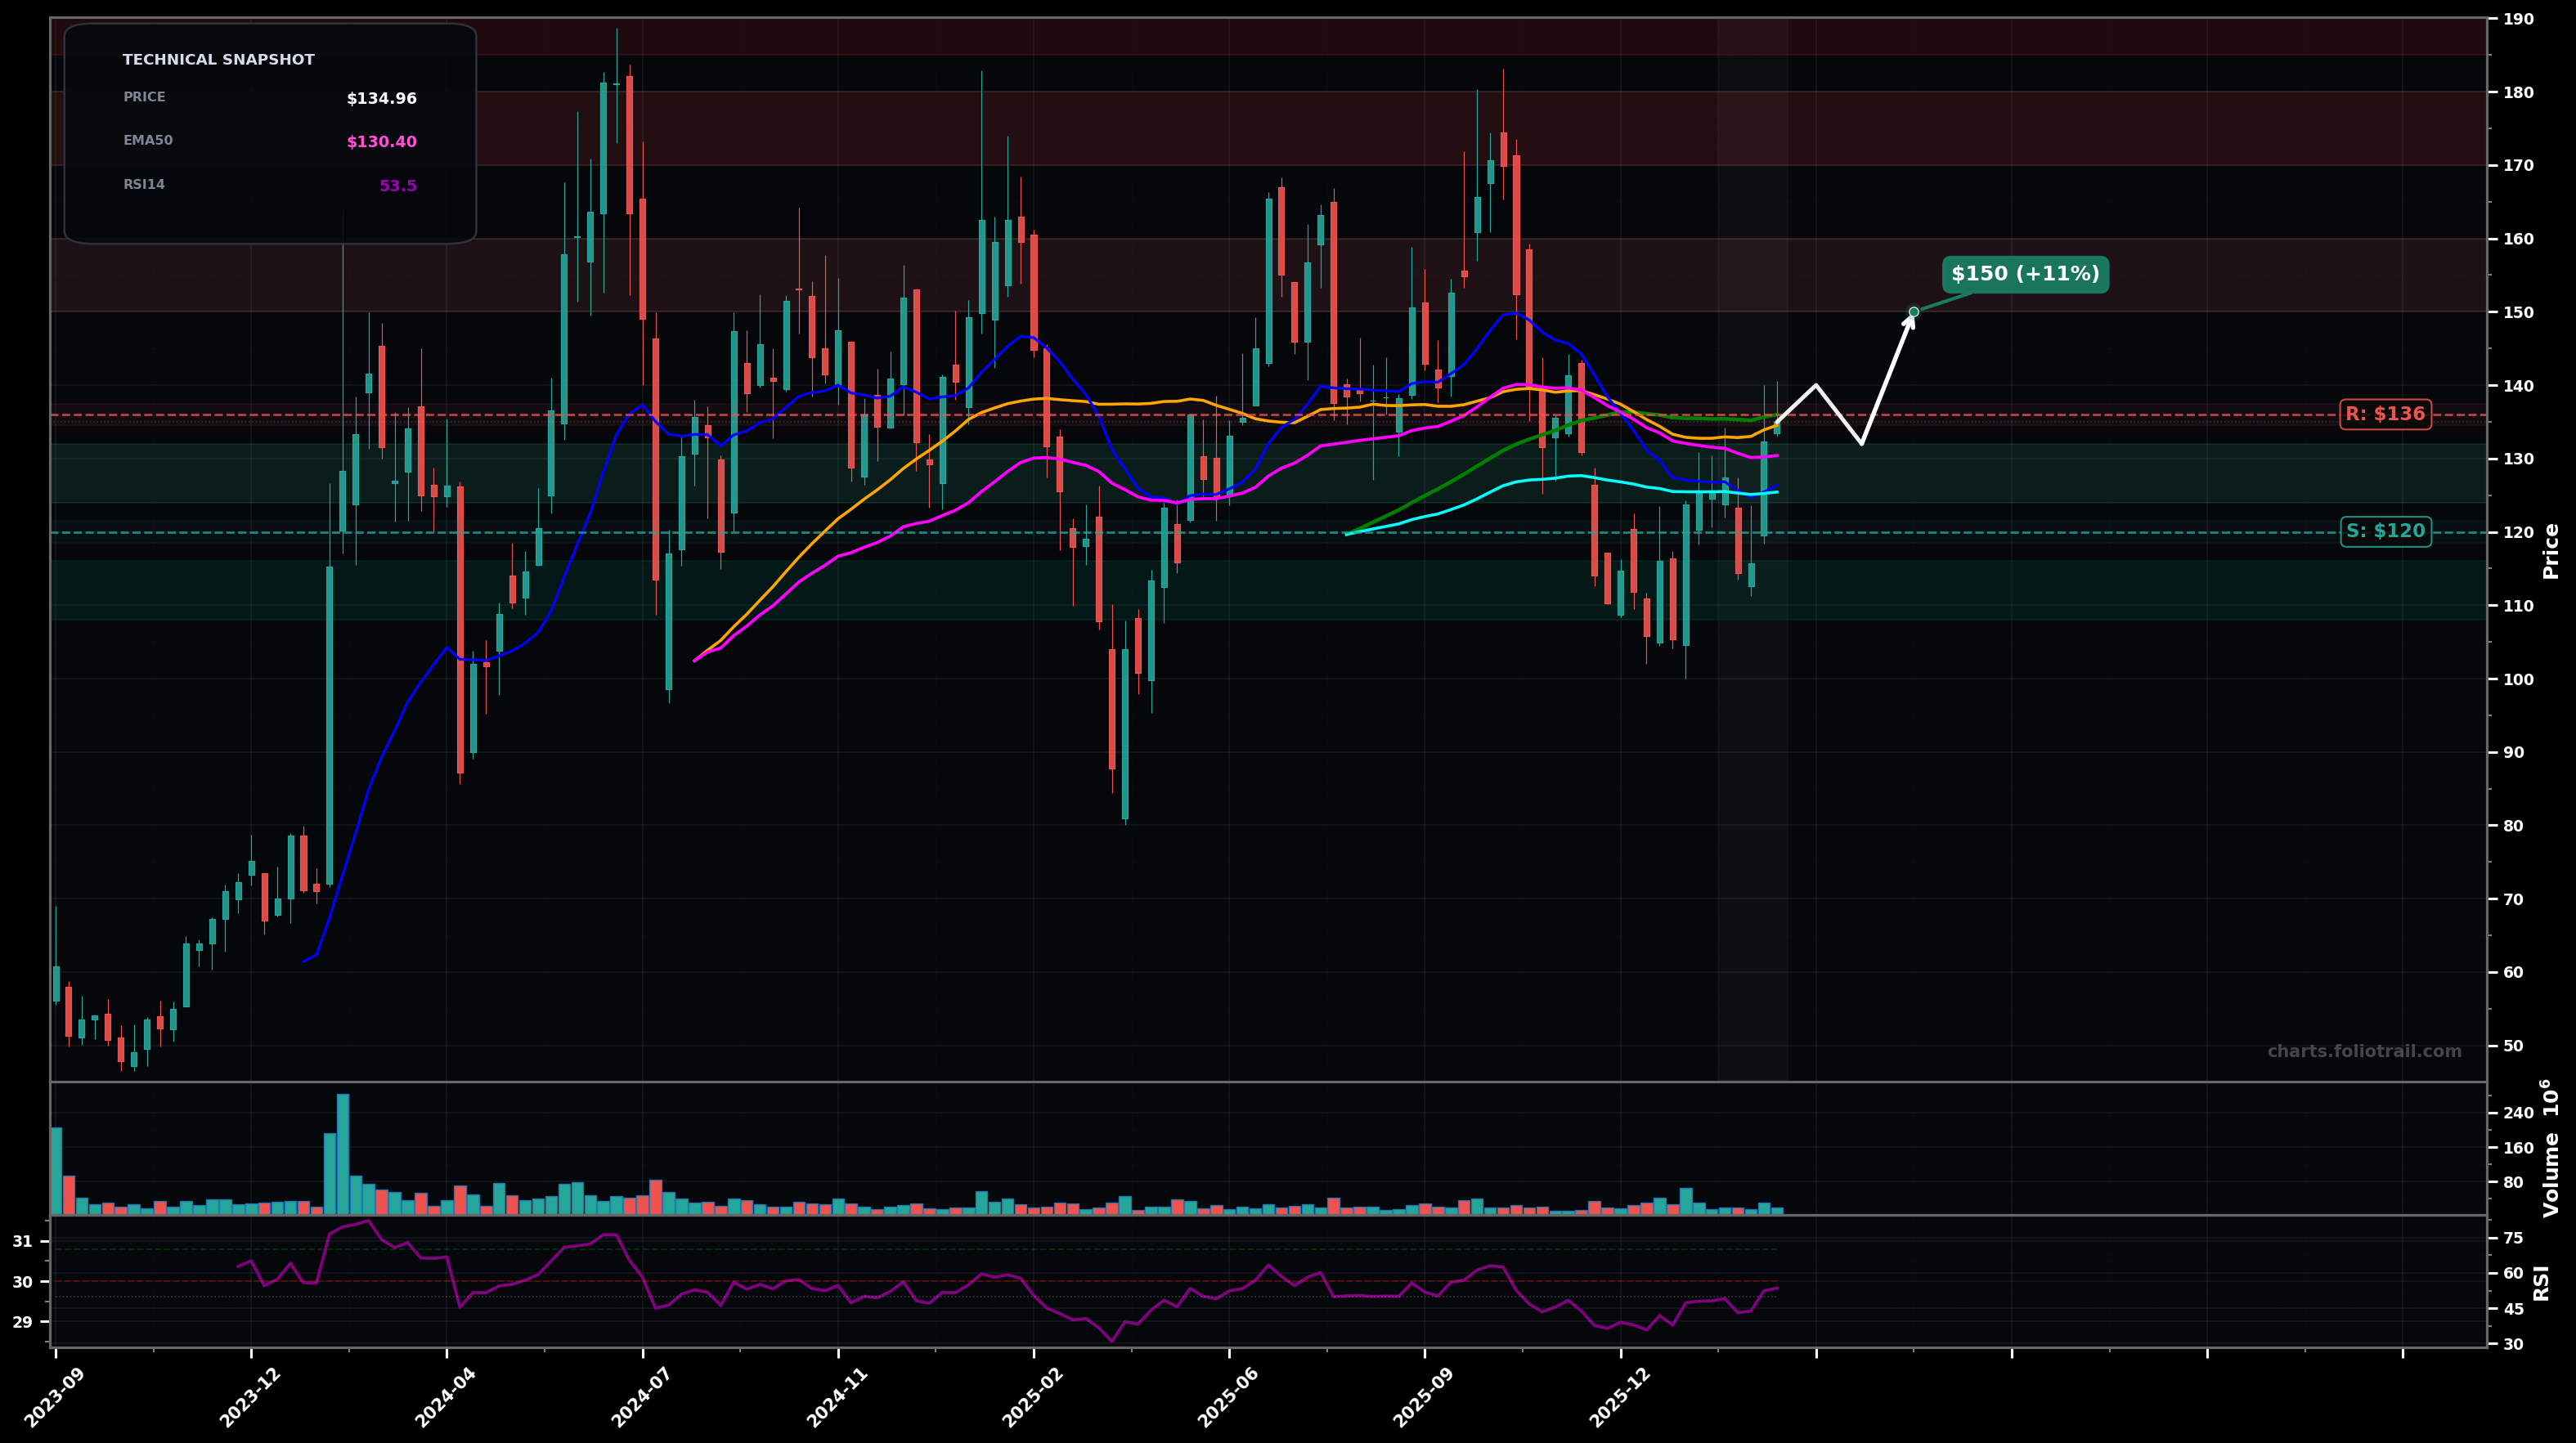
As of March 25, 2026, ARM (Arm Holdings plc) is in a choppy range state on the weekly chart, with a confidence level of 64%. Key support is at $120 and key resistance at $136. Weekly price ~$134.96 is trying to base after a sharp selloff from the ~$170s; it’s back above EMA50 (~$130.40) but still under the SMA100 (~$135.98) with overlapping candles.
Base continues and resolves up: price holds above EMA50 and grinds through $136, then targets the next supply zone near prior breakdown and fib retrace area.
Range fails: rejection at $136 followed by a roll-over back under EMA50 and a retest of the lower range (and possibly the prior swing low zone).
2+ weekly closes above $136-$140 (reclaim SMA100 and hold) would confirm breakout-reversal behavior
Weekly close below $120 would invalidate the range/basing read and re-open downside trend risk
Scale near range support/EMA cluster: start on pullbacks above $120, add on breakdown-retest of $120, heavy add only near prior swing-low demand ~$110 area.
Trim into major prior supply zones: ~$150-160 (mid-retrace), then ~$170-180 (prior swing highs), close into $185-195 if price gets stretched back to/above old peaks.
As of March 25, 2026, ARM (Arm Holdings plc) is in a choppy range state on the weekly chart with 64% confidence. Weekly price ~$134.96 is trying to base after a sharp selloff from the ~$170s; it’s back above EMA50 (~$130.40) but still under the SMA100 (~$135.98) with overlapping candles.
On the weekly timeframe, ARM has key support at $120 and key resistance at $136. The most likely scenario (bullish) targets $140 and $150, with a revert level at $132.
ARM (Arm Holdings plc) is currently classified as choppy range on the weekly chart, with 64% confidence. Confirmation requires: 2+ weekly closes above $136-$140 (reclaim SMA100 and hold) would confirm breakout-reversal behavior This would be invalidated by: Weekly close below $120 would invalidate the range/basing read and re-open downside trend risk
The most likely scenario (bullish) targets $140 and $150, with a revert level at $132. The alternative scenario (bearish) targets $120 and $110.
Multi-layer AI agents analyse 200+ stocks across daily, weekly, and monthly timeframes — producing market state classifications, price scenarios with targets, and position entry/exit levels. Updated every trading day after market close. No paywall. No sign-up required.
Built by Foliotrail.
All content on this website — including charts, analysis, price targets, support/resistance levels, and position zones — is generated entirely by AI and provided for educational and informational purposes only.
This is not financial advice. NEXUSNOIR VENTURES SL (the operator of this website) is not a registered investment adviser or broker-dealer. You should not make investment decisions based solely on this information. Always do your own research and consult a qualified financial advisor.
By continuing, you acknowledge that you have read and agree to our full disclaimer & terms of use and privacy policy.