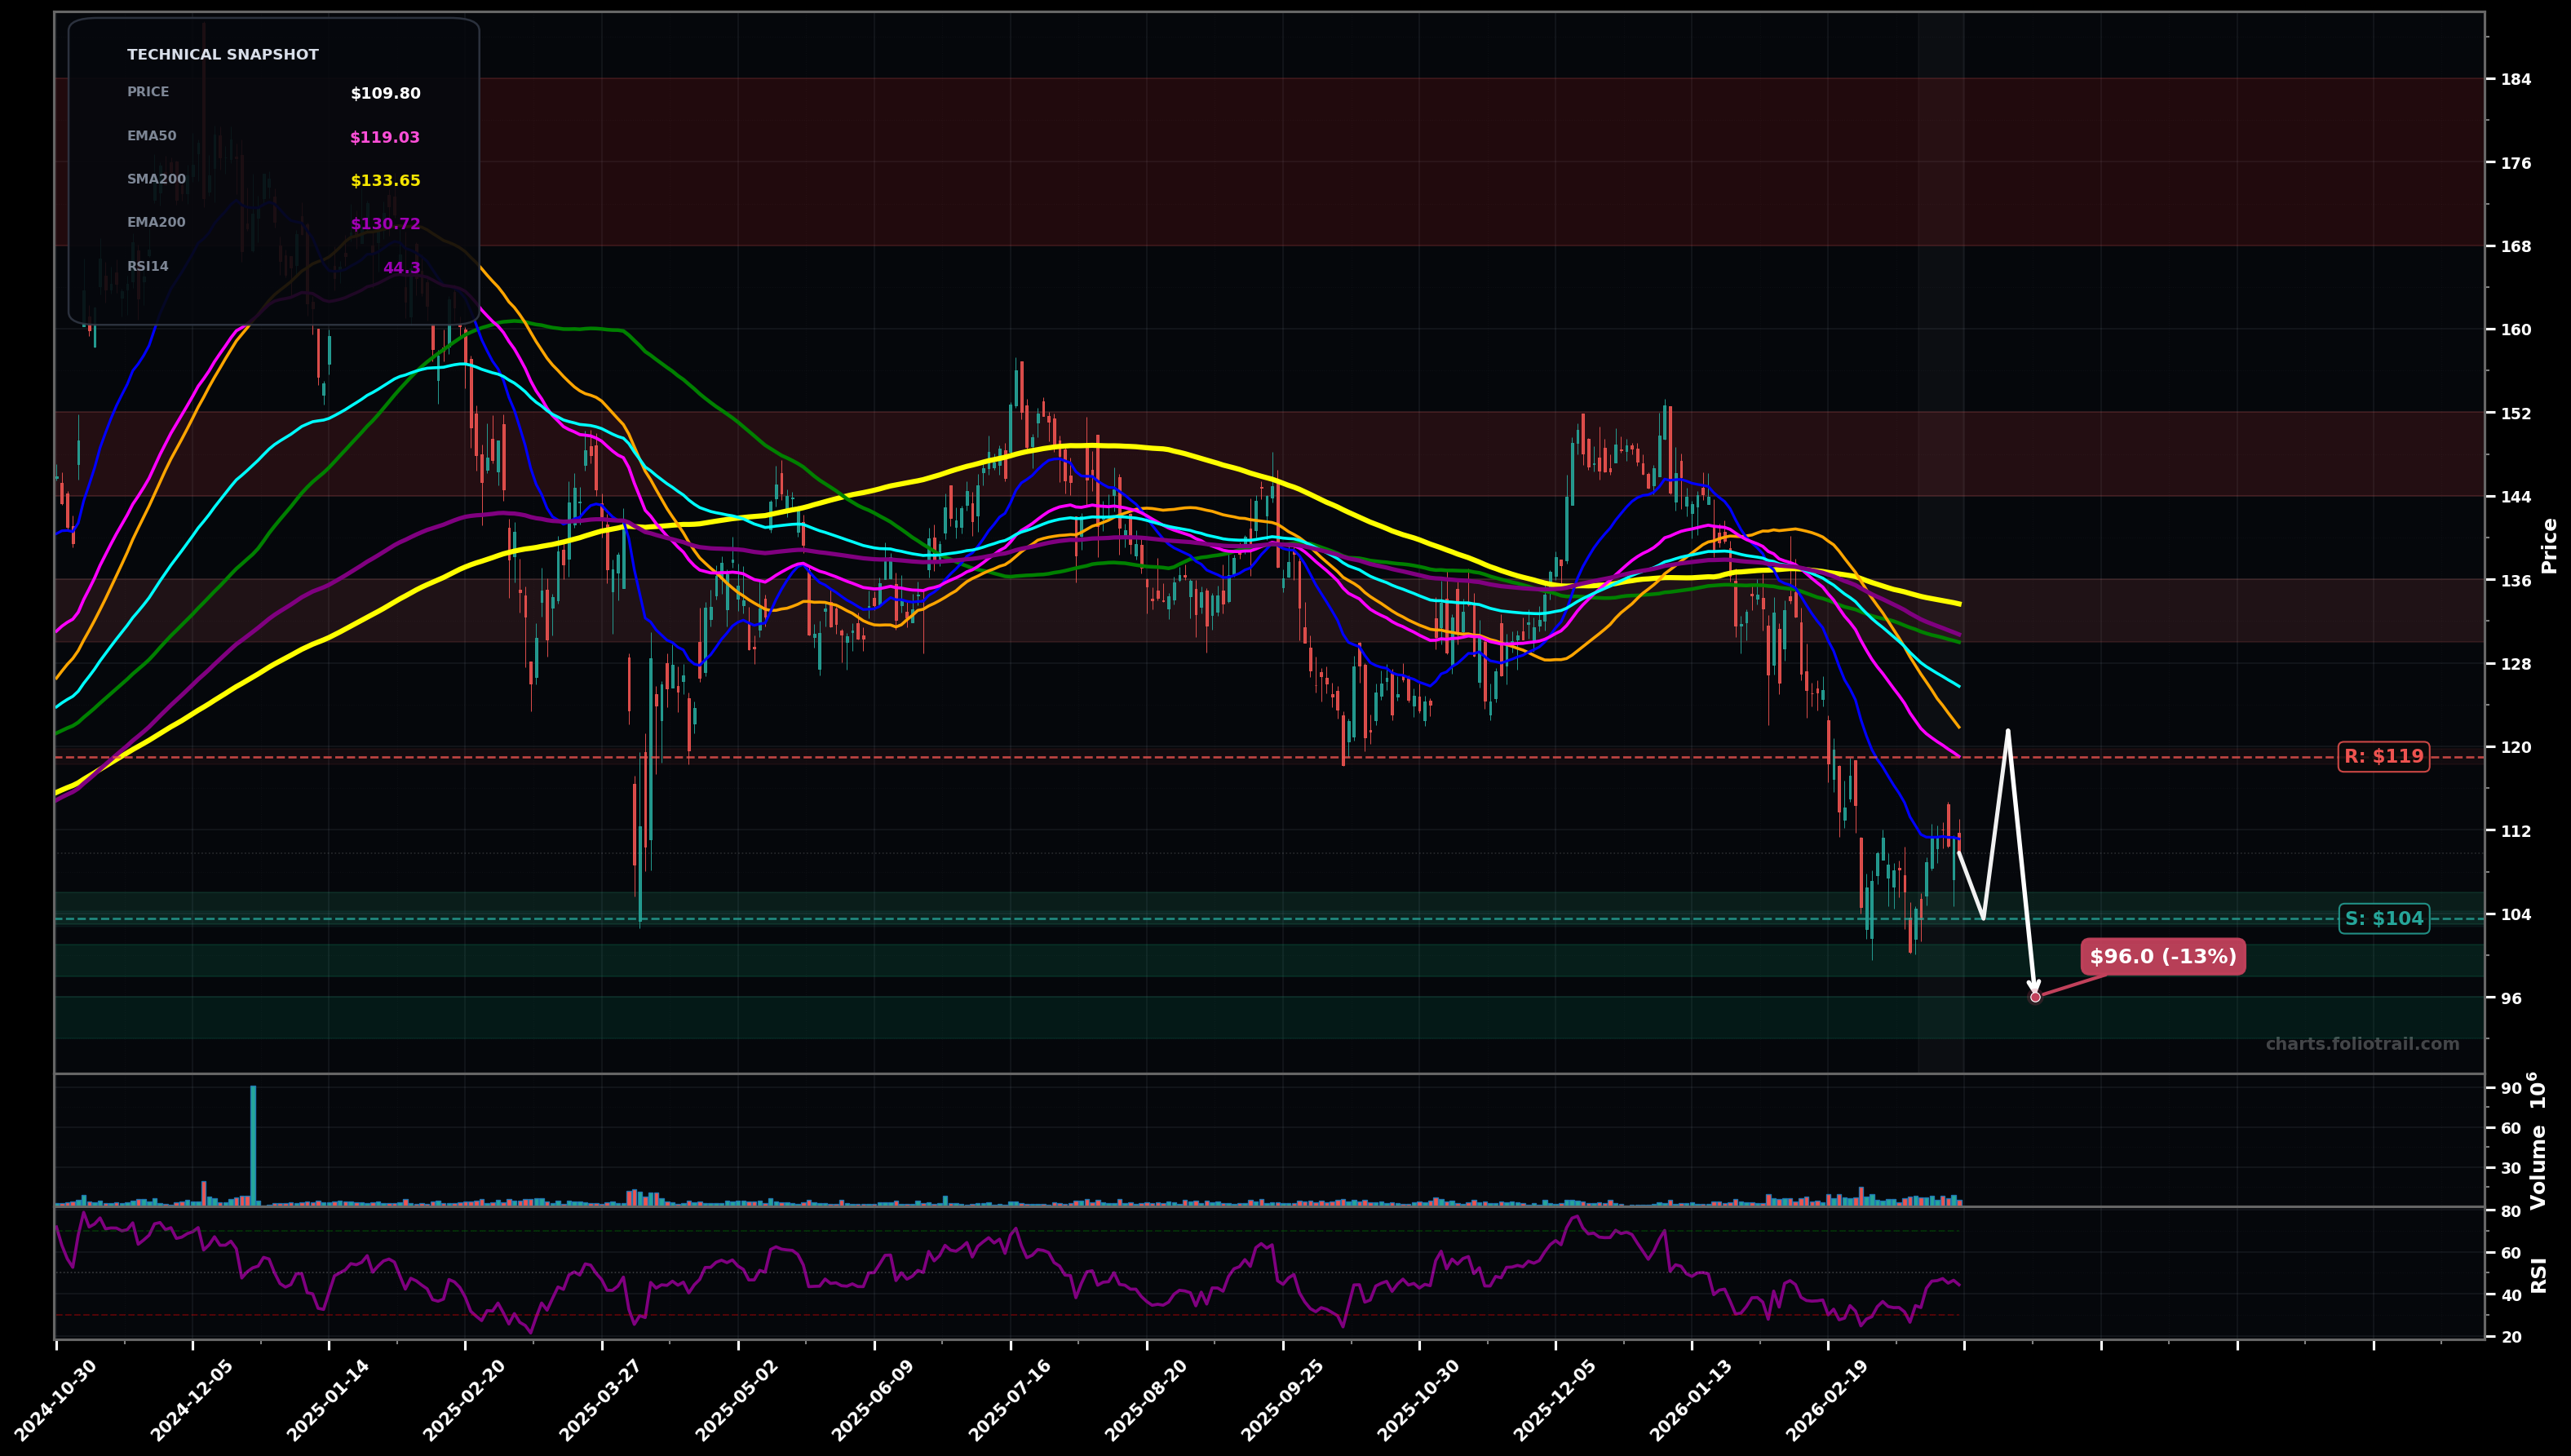
As of March 26, 2026, APO (Apollo Global Management, Inc.) is in a downtrend state on the daily chart, with a confidence level of 74%. Key support is at $104 and key resistance at $119. Price is bouncing off a fresh swing low near $103-$105 but remains below all key MAs; latest close ~$109.80 is still under EMA50 (~$119) and EMA100 (~$126).
Bear-flag / weak rebound into the $119-$126 MA band (EMA50/EMA100) then sellers defend and price rolls over to retest $103.50; if it breaks, continuation to the next demand zone.
Bottoming attempt: price holds $103-$105, forms a higher low, then pushes through EMA50 and works toward the thicker resistance shelf near the long MAs.
Daily close below $103.00 (break of the swing-low reference) confirms continuation lower
2+ daily closes back above $119.00 (EMA50 reclaim) invalidates immediate downtrend pressure
DCA around the swing-low reference ($103-$105); add on a controlled breakdown into next Fib/demand pocket ($98-$101); heavy add near deeper support where capitulation often ends wave-5 style moves ($92-$96).
Trim into the MA-overhead supply zone first ($130-$136), more aggressively near prior swing supply ($144-$152), and consider full exit only if a full mean-reversion/extension run approaches prior-cycle extremes ($168-$184).
As of March 26, 2026, APO (Apollo Global Management, Inc.) is in a downtrend state on the daily chart with 74% confidence. Price is bouncing off a fresh swing low near $103-$105 but remains below all key MAs; latest close ~$109.80 is still under EMA50 (~$119) and EMA100 (~$126).
On the daily timeframe, APO has key support at $104 and key resistance at $119. The most likely scenario (bearish) targets $104 and $96.0, with a revert level at $122.
APO (Apollo Global Management, Inc.) is currently classified as downtrend on the daily chart, with 74% confidence. Confirmation requires: Daily close below $103.00 (break of the swing-low reference) confirms continuation lower This would be invalidated by: 2+ daily closes back above $119.00 (EMA50 reclaim) invalidates immediate downtrend pressure
The most likely scenario (bearish) targets $104 and $96.0, with a revert level at $122. The alternative scenario (bullish) targets $119 and $130.
Multi-layer AI agents analyse 200+ stocks across daily, weekly, and monthly timeframes — producing market state classifications, price scenarios with targets, and position entry/exit levels. Updated every trading day after market close. No paywall. No sign-up required.
Built by Foliotrail.
All content on this website — including charts, analysis, price targets, support/resistance levels, and position zones — is generated entirely by AI and provided for educational and informational purposes only.
This is not financial advice. NEXUSNOIR VENTURES SL (the operator of this website) is not a registered investment adviser or broker-dealer. You should not make investment decisions based solely on this information. Always do your own research and consult a qualified financial advisor.
By continuing, you acknowledge that you have read and agree to our full disclaimer & terms of use and privacy policy.