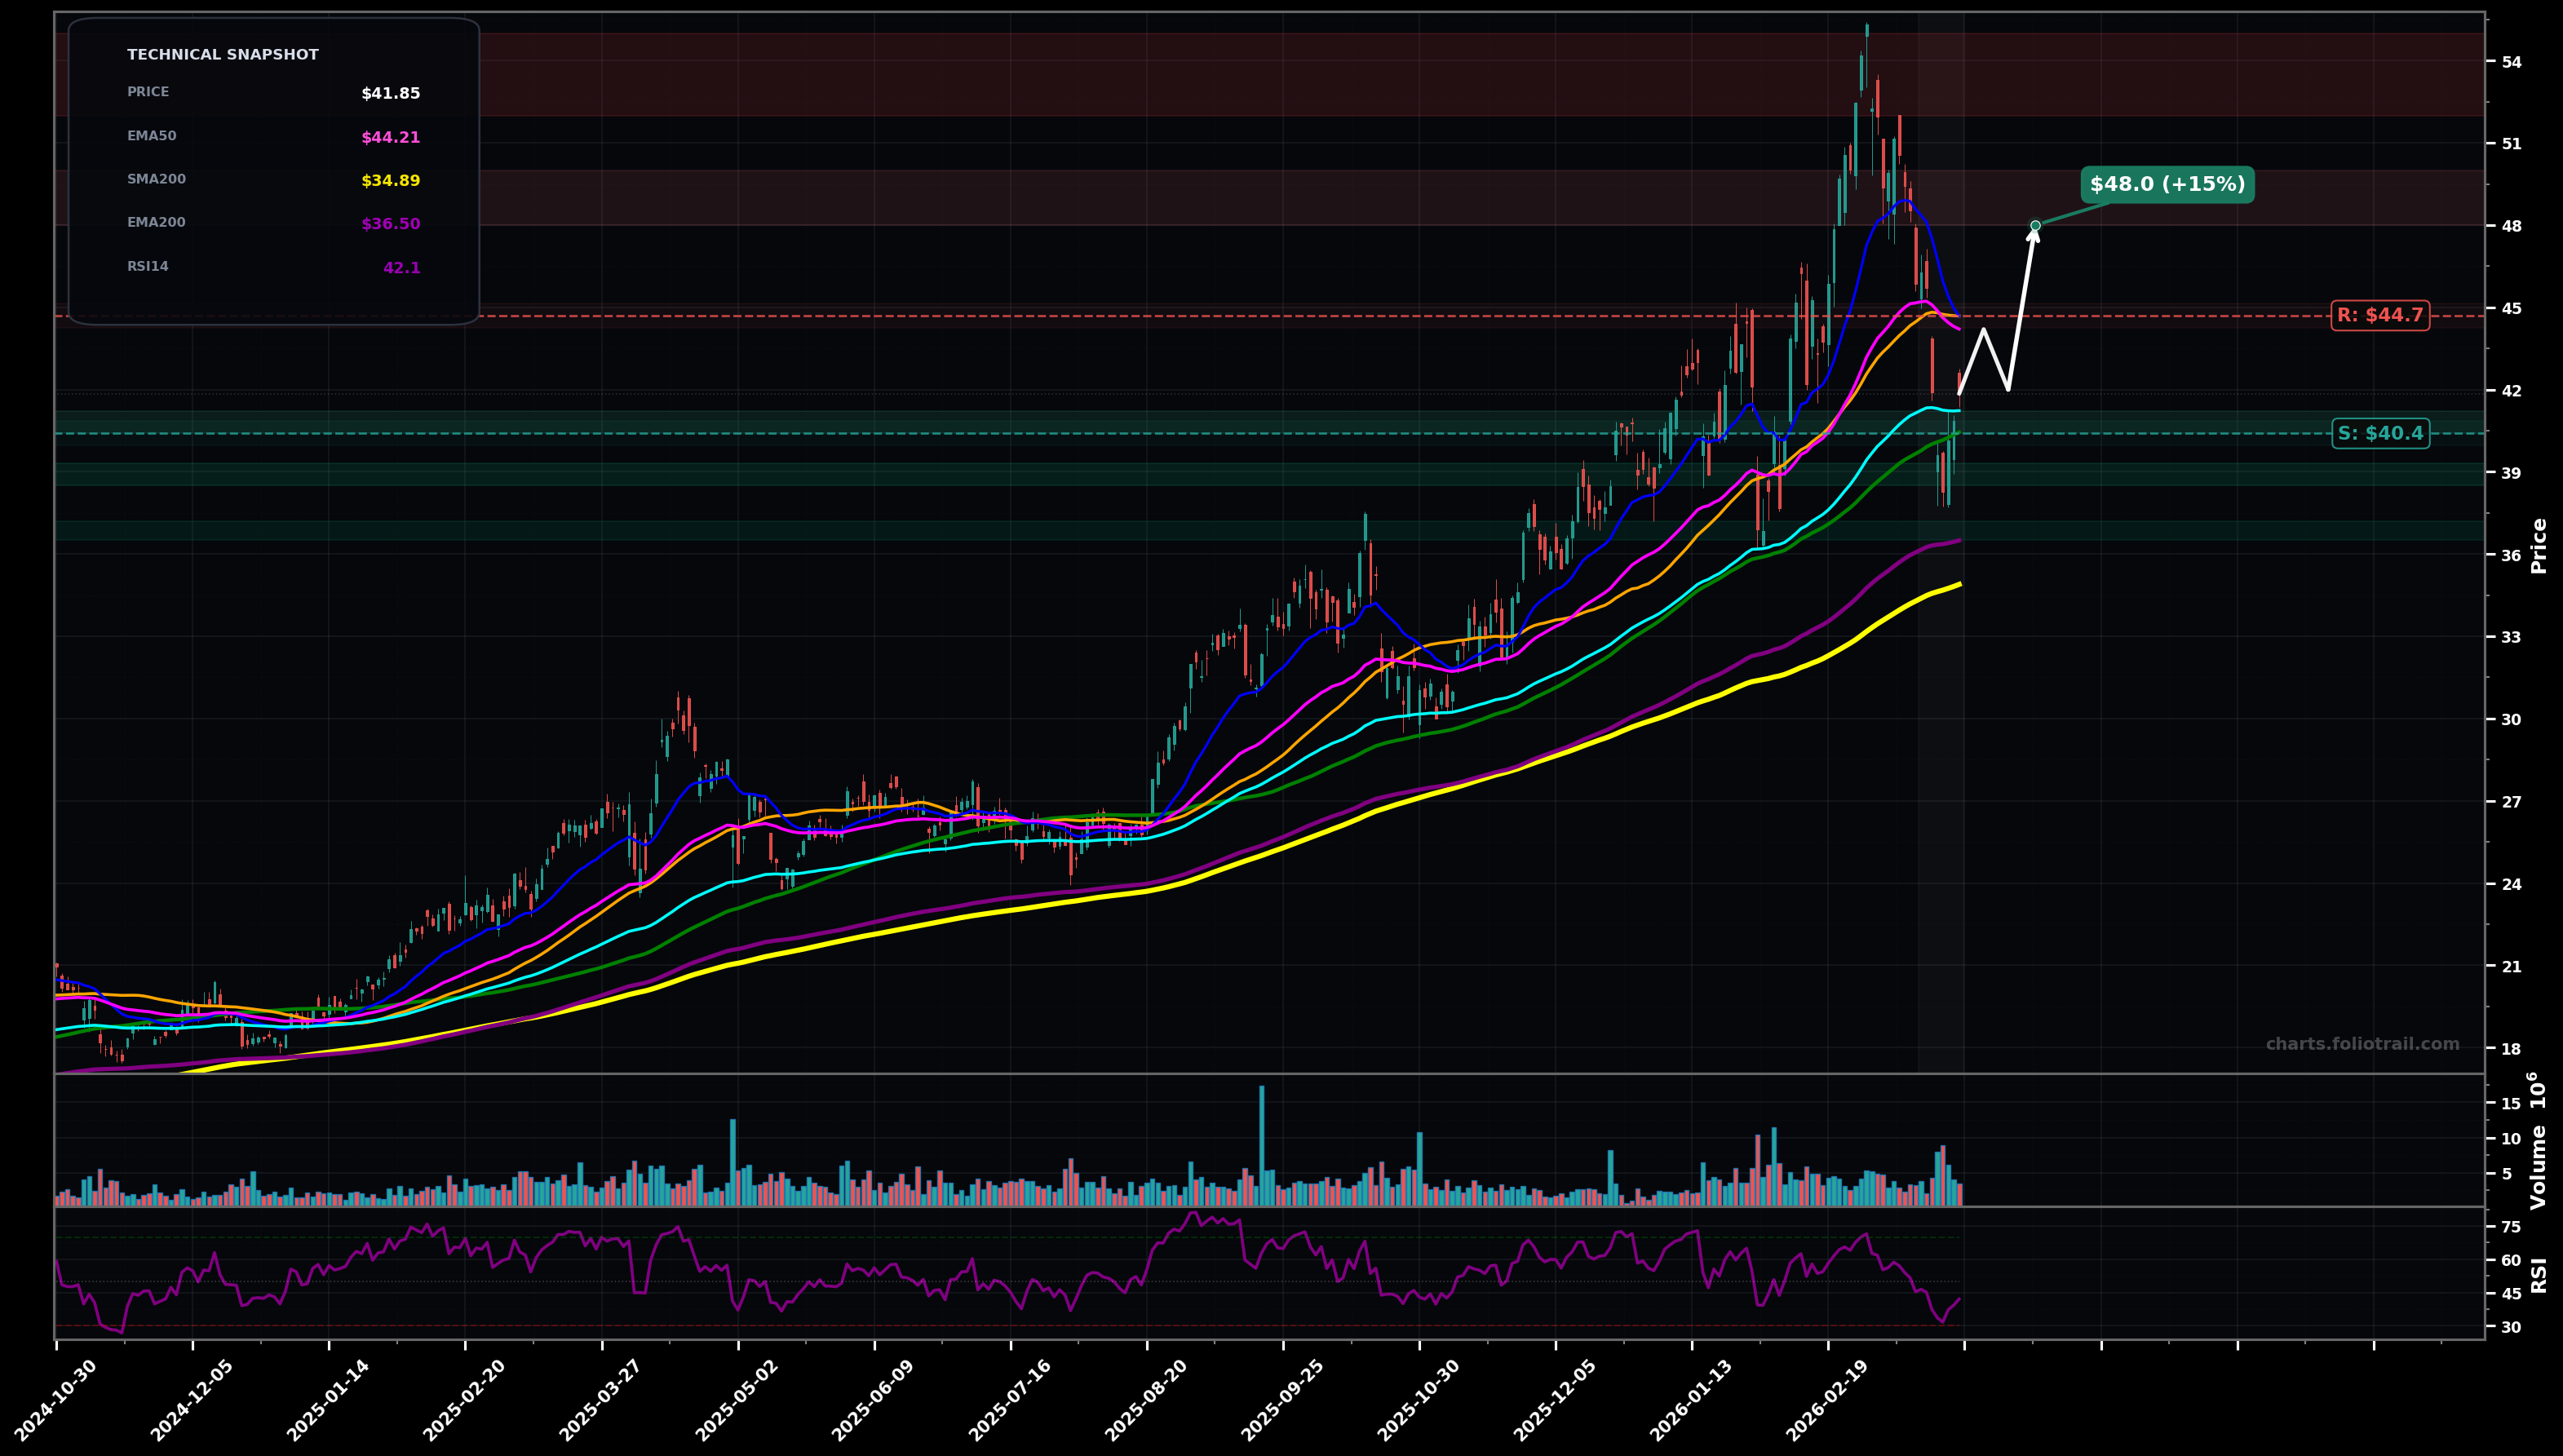
As of March 26, 2026, AGI (Alamos Gold Inc.) is in a volatility expansion state on the daily chart, with a confidence level of 68%. Key support is at $40.4 and key resistance at $44.7. Sharp pullback from ~$55 peak into a bounce; price (~$41.85) is below the fast MAs (SMA50/EMA50) but still above the medium/long MAs (EMA100/SMA100/EMA200), with RSI ~42 showing cooling momentum.
Base-and-bounce: price holds the $40.40–$41.20 cluster (SMA100/EMA100) and mean-reverts upward toward the broken fast MAs; this would likely be an Elliott Wave (4) style pullback finishing before a potential continuation leg.
Deeper retrace: failure to hold $40.40 leads to a drop toward the next confluence zone (EMA200 + prior breakout area); this would fit a larger corrective wave (A) pushing price back into the prior base.
VOLATILITY_EXPANSION confirmed if daily ranges stay elevated and price fails to reclaim $44.20 and then breaks below $40.40 on a close.
This state is invalidated if price reclaims and holds above $44.70 for 2+ closes (range contraction + trend resumption).
Start near EMA100/SMA100 support; add on a Fibonacci-style deeper retrace toward prior demand; heavy add at EMA200 (~$36.50) where trend-support and base structure likely converge.
Trim into mean-reversion back above fast MAs and prior supply; heavier trim near the recent blow-off top zone (~$55); close if a new extended wave-up pushes into a fresh stretched extension above prior highs.
As of March 26, 2026, AGI (Alamos Gold Inc.) is in a volatility expansion state on the daily chart with 68% confidence. Sharp pullback from ~$55 peak into a bounce; price (~$41.85) is below the fast MAs (SMA50/EMA50) but still above the medium/long MAs (EMA100/SMA100/EMA200), with RSI ~42 showing cooling momentum.
On the daily timeframe, AGI has key support at $40.4 and key resistance at $44.7. The most likely scenario (bullish) targets $44.2 and $48.0, with a revert level at $42.0.
AGI (Alamos Gold Inc.) is currently classified as volatility expansion on the daily chart, with 68% confidence. Confirmation requires: VOLATILITY_EXPANSION confirmed if daily ranges stay elevated and price fails to reclaim $44.20 and then breaks below $40.40 on a close. This would be invalidated by: This state is invalidated if price reclaims and holds above $44.70 for 2+ closes (range contraction + trend resumption).
The most likely scenario (bullish) targets $44.2 and $48.0, with a revert level at $42.0. The alternative scenario (bearish) targets $38.5 and $36.5.
Multi-layer AI agents analyse 200+ stocks across daily, weekly, and monthly timeframes — producing market state classifications, price scenarios with targets, and position entry/exit levels. Updated every trading day after market close. No paywall. No sign-up required.
Built by Foliotrail.
All content on this website — including charts, analysis, price targets, support/resistance levels, and position zones — is generated entirely by AI and provided for educational and informational purposes only.
This is not financial advice. NEXUSNOIR VENTURES SL (the operator of this website) is not a registered investment adviser or broker-dealer. You should not make investment decisions based solely on this information. Always do your own research and consult a qualified financial advisor.
By continuing, you acknowledge that you have read and agree to our full disclaimer & terms of use and privacy policy.