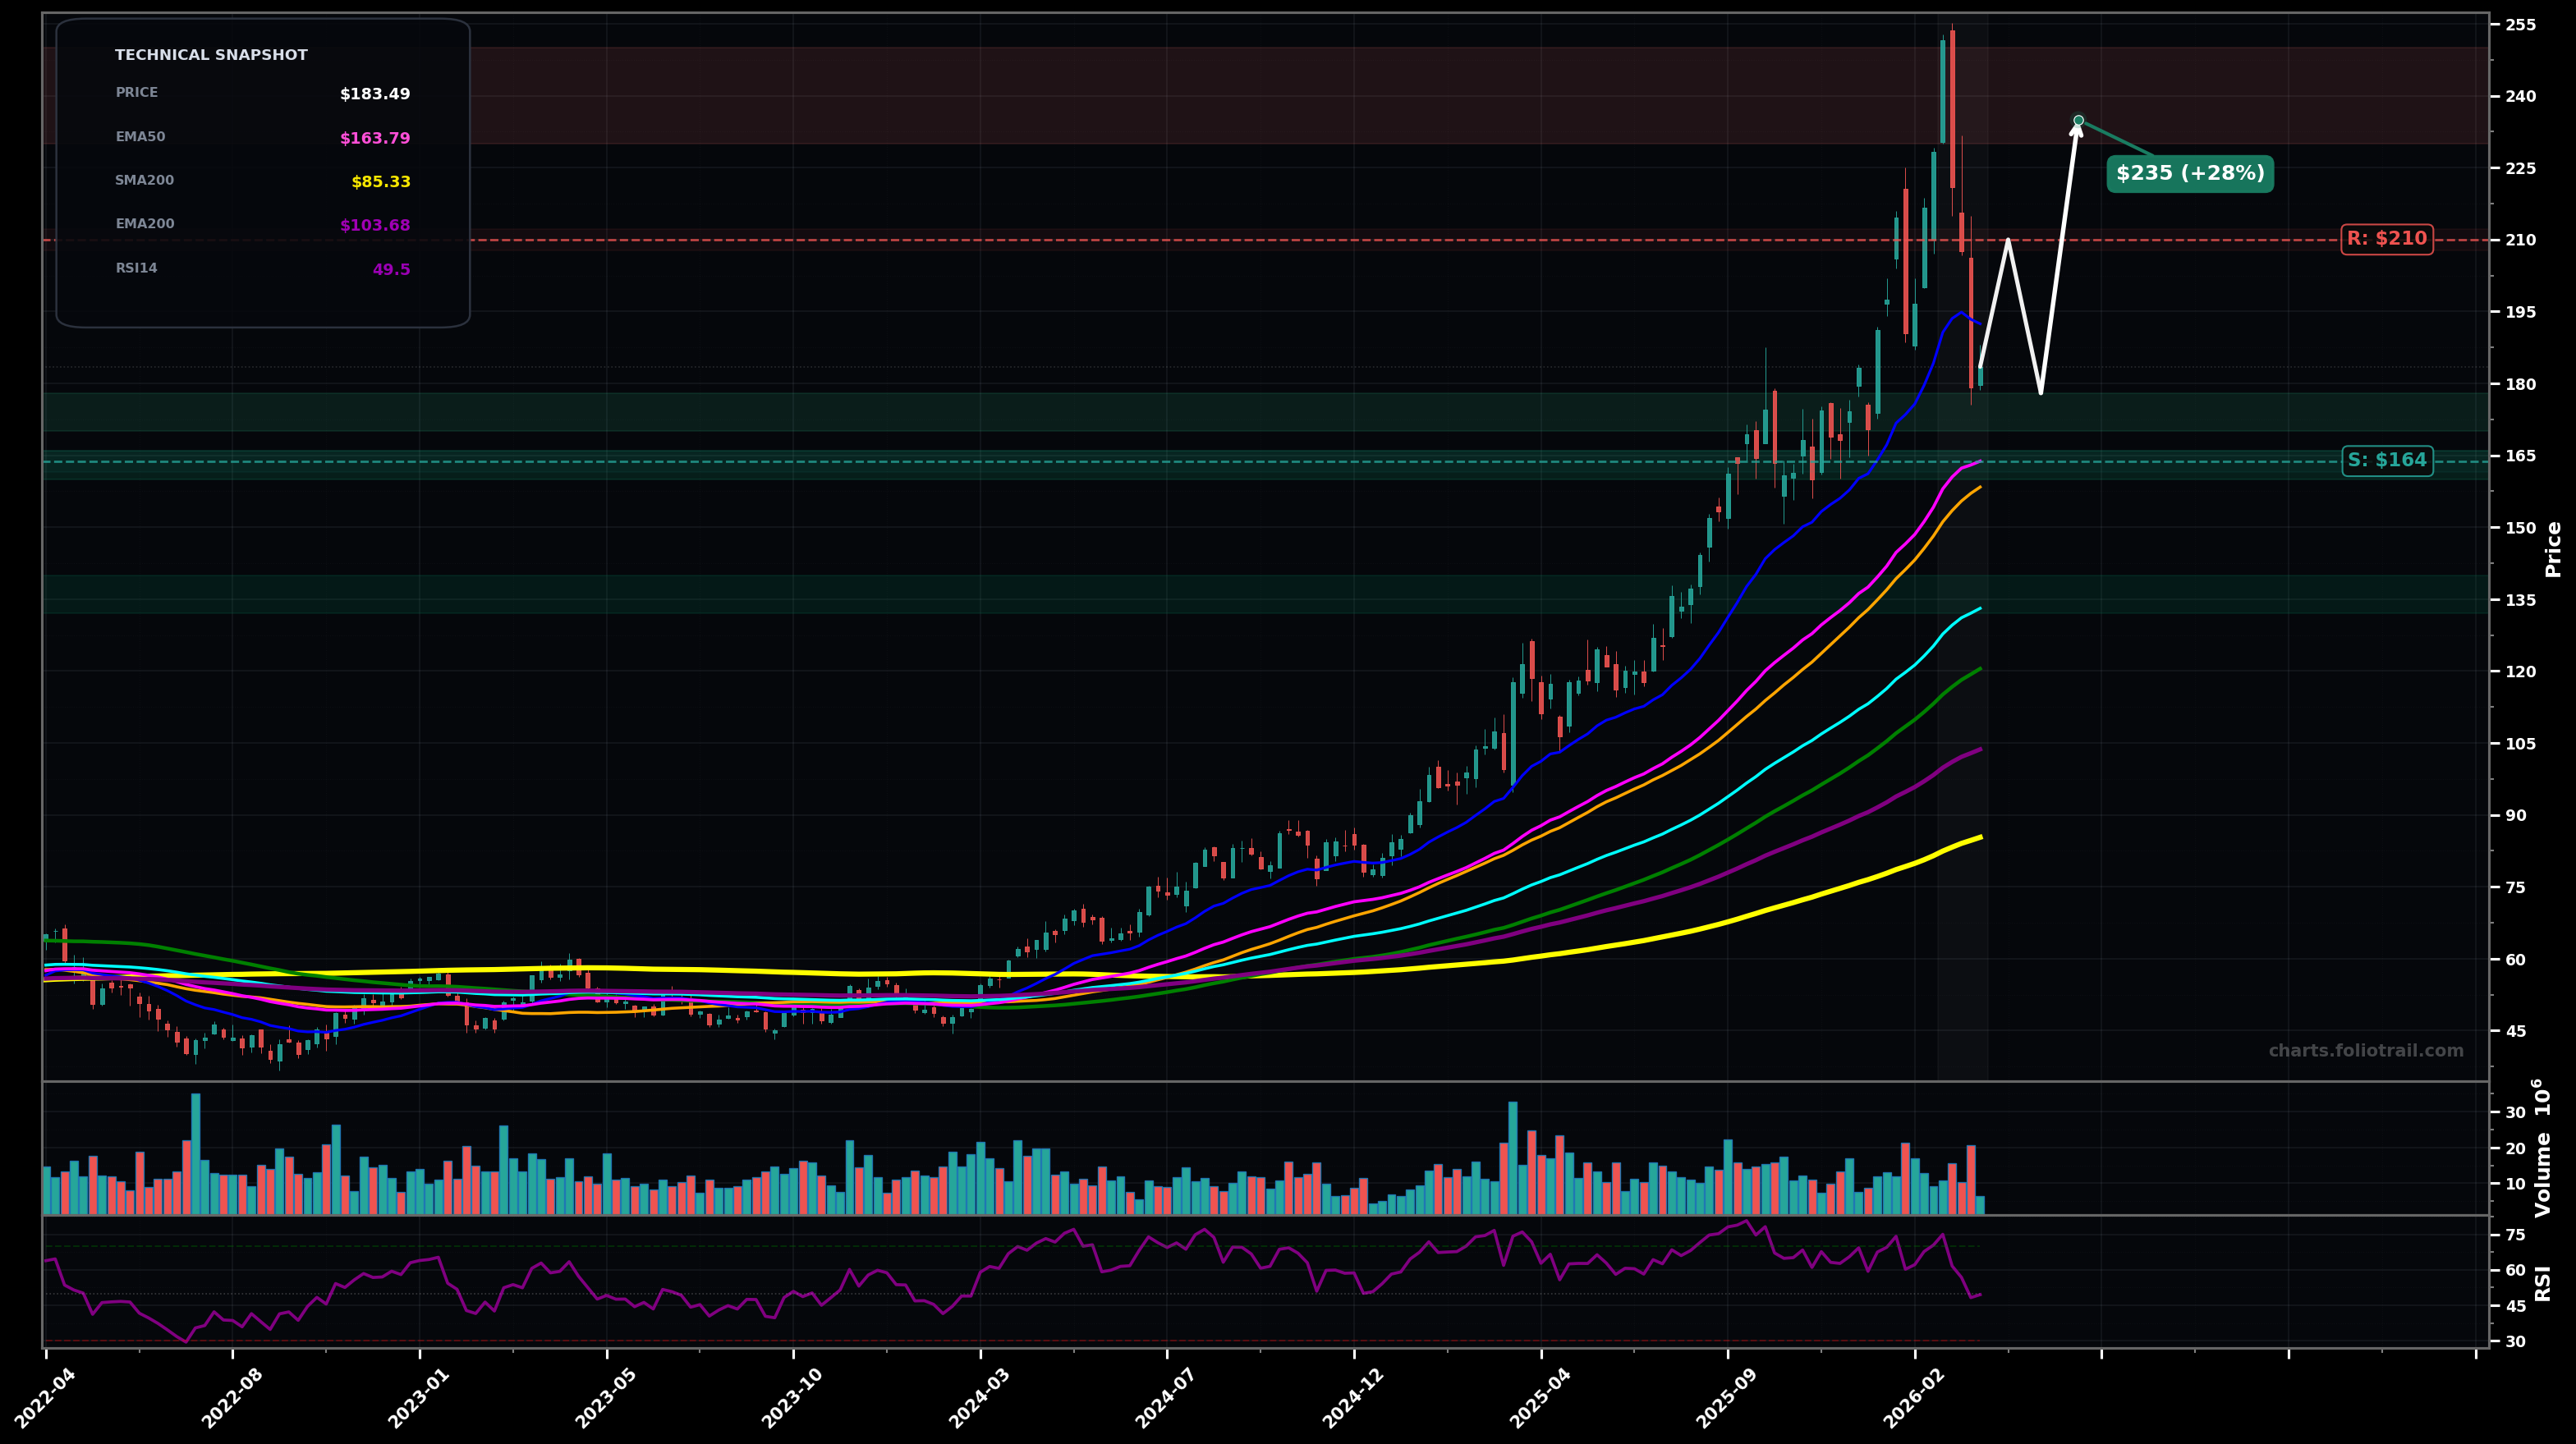
As of March 25, 2026, AEM (Agnico Eagle Mines Limited) is in a volatility expansion state on the weekly chart, with a confidence level of 74%. Key support is at $164 and key resistance at $210. Sharp pullback from a blow-off high near ~$250s; price now ~$183.49, still above EMA50/EMA100 but momentum cooled (RSI ~49.5).
Base-building / ABC correction completes above EMA50, then trend resumes up: expect a retest of ~$210 first, then a run toward the prior breakdown area and fib extensions.
Deeper Wave-4 style correction: lose EMA50 and drift toward the confluence zone around SMA50/EMA20 before attempting to stabilize; risk of a fast flush increases if $160 fails.
Weekly close below $163.79 (EMA50) with follow-through
Weekly close back above $210.00 and hold for 2 closes
Scale around prior pivot/psych support ($170s) then EMA50 confluence ($160s); if correction deepens, heavy add near EMA100 (~$133) as higher-timeframe trend support.
Prior blow-off/ATH supply zone ($230–$250) then fib-extension territory; progressively trim more as price gets increasingly stretched vs rising EMA50/EMA100 and prior volatility peak.
As of March 25, 2026, AEM (Agnico Eagle Mines Limited) is in a volatility expansion state on the weekly chart with 74% confidence. Sharp pullback from a blow-off high near ~$250s; price now ~$183.49, still above EMA50/EMA100 but momentum cooled (RSI ~49.5).
On the weekly timeframe, AEM has key support at $164 and key resistance at $210. The most likely scenario (bullish) targets $210 and $235, with a revert level at $178.
AEM (Agnico Eagle Mines Limited) is currently classified as volatility expansion on the weekly chart, with 74% confidence. Confirmation requires: Weekly close below $163.79 (EMA50) with follow-through This would be invalidated by: Weekly close back above $210.00 and hold for 2 closes
The most likely scenario (bullish) targets $210 and $235, with a revert level at $178. The alternative scenario (bearish) targets $158 and $133.
Multi-layer AI agents analyse 200+ stocks across daily, weekly, and monthly timeframes — producing market state classifications, price scenarios with targets, and position entry/exit levels. Updated every trading day after market close. No paywall. No sign-up required.
Built by Foliotrail.
All content on this website — including charts, analysis, price targets, support/resistance levels, and position zones — is generated entirely by AI and provided for educational and informational purposes only.
This is not financial advice. NEXUSNOIR VENTURES SL (the operator of this website) is not a registered investment adviser or broker-dealer. You should not make investment decisions based solely on this information. Always do your own research and consult a qualified financial advisor.
By continuing, you acknowledge that you have read and agree to our full disclaimer & terms of use and privacy policy.