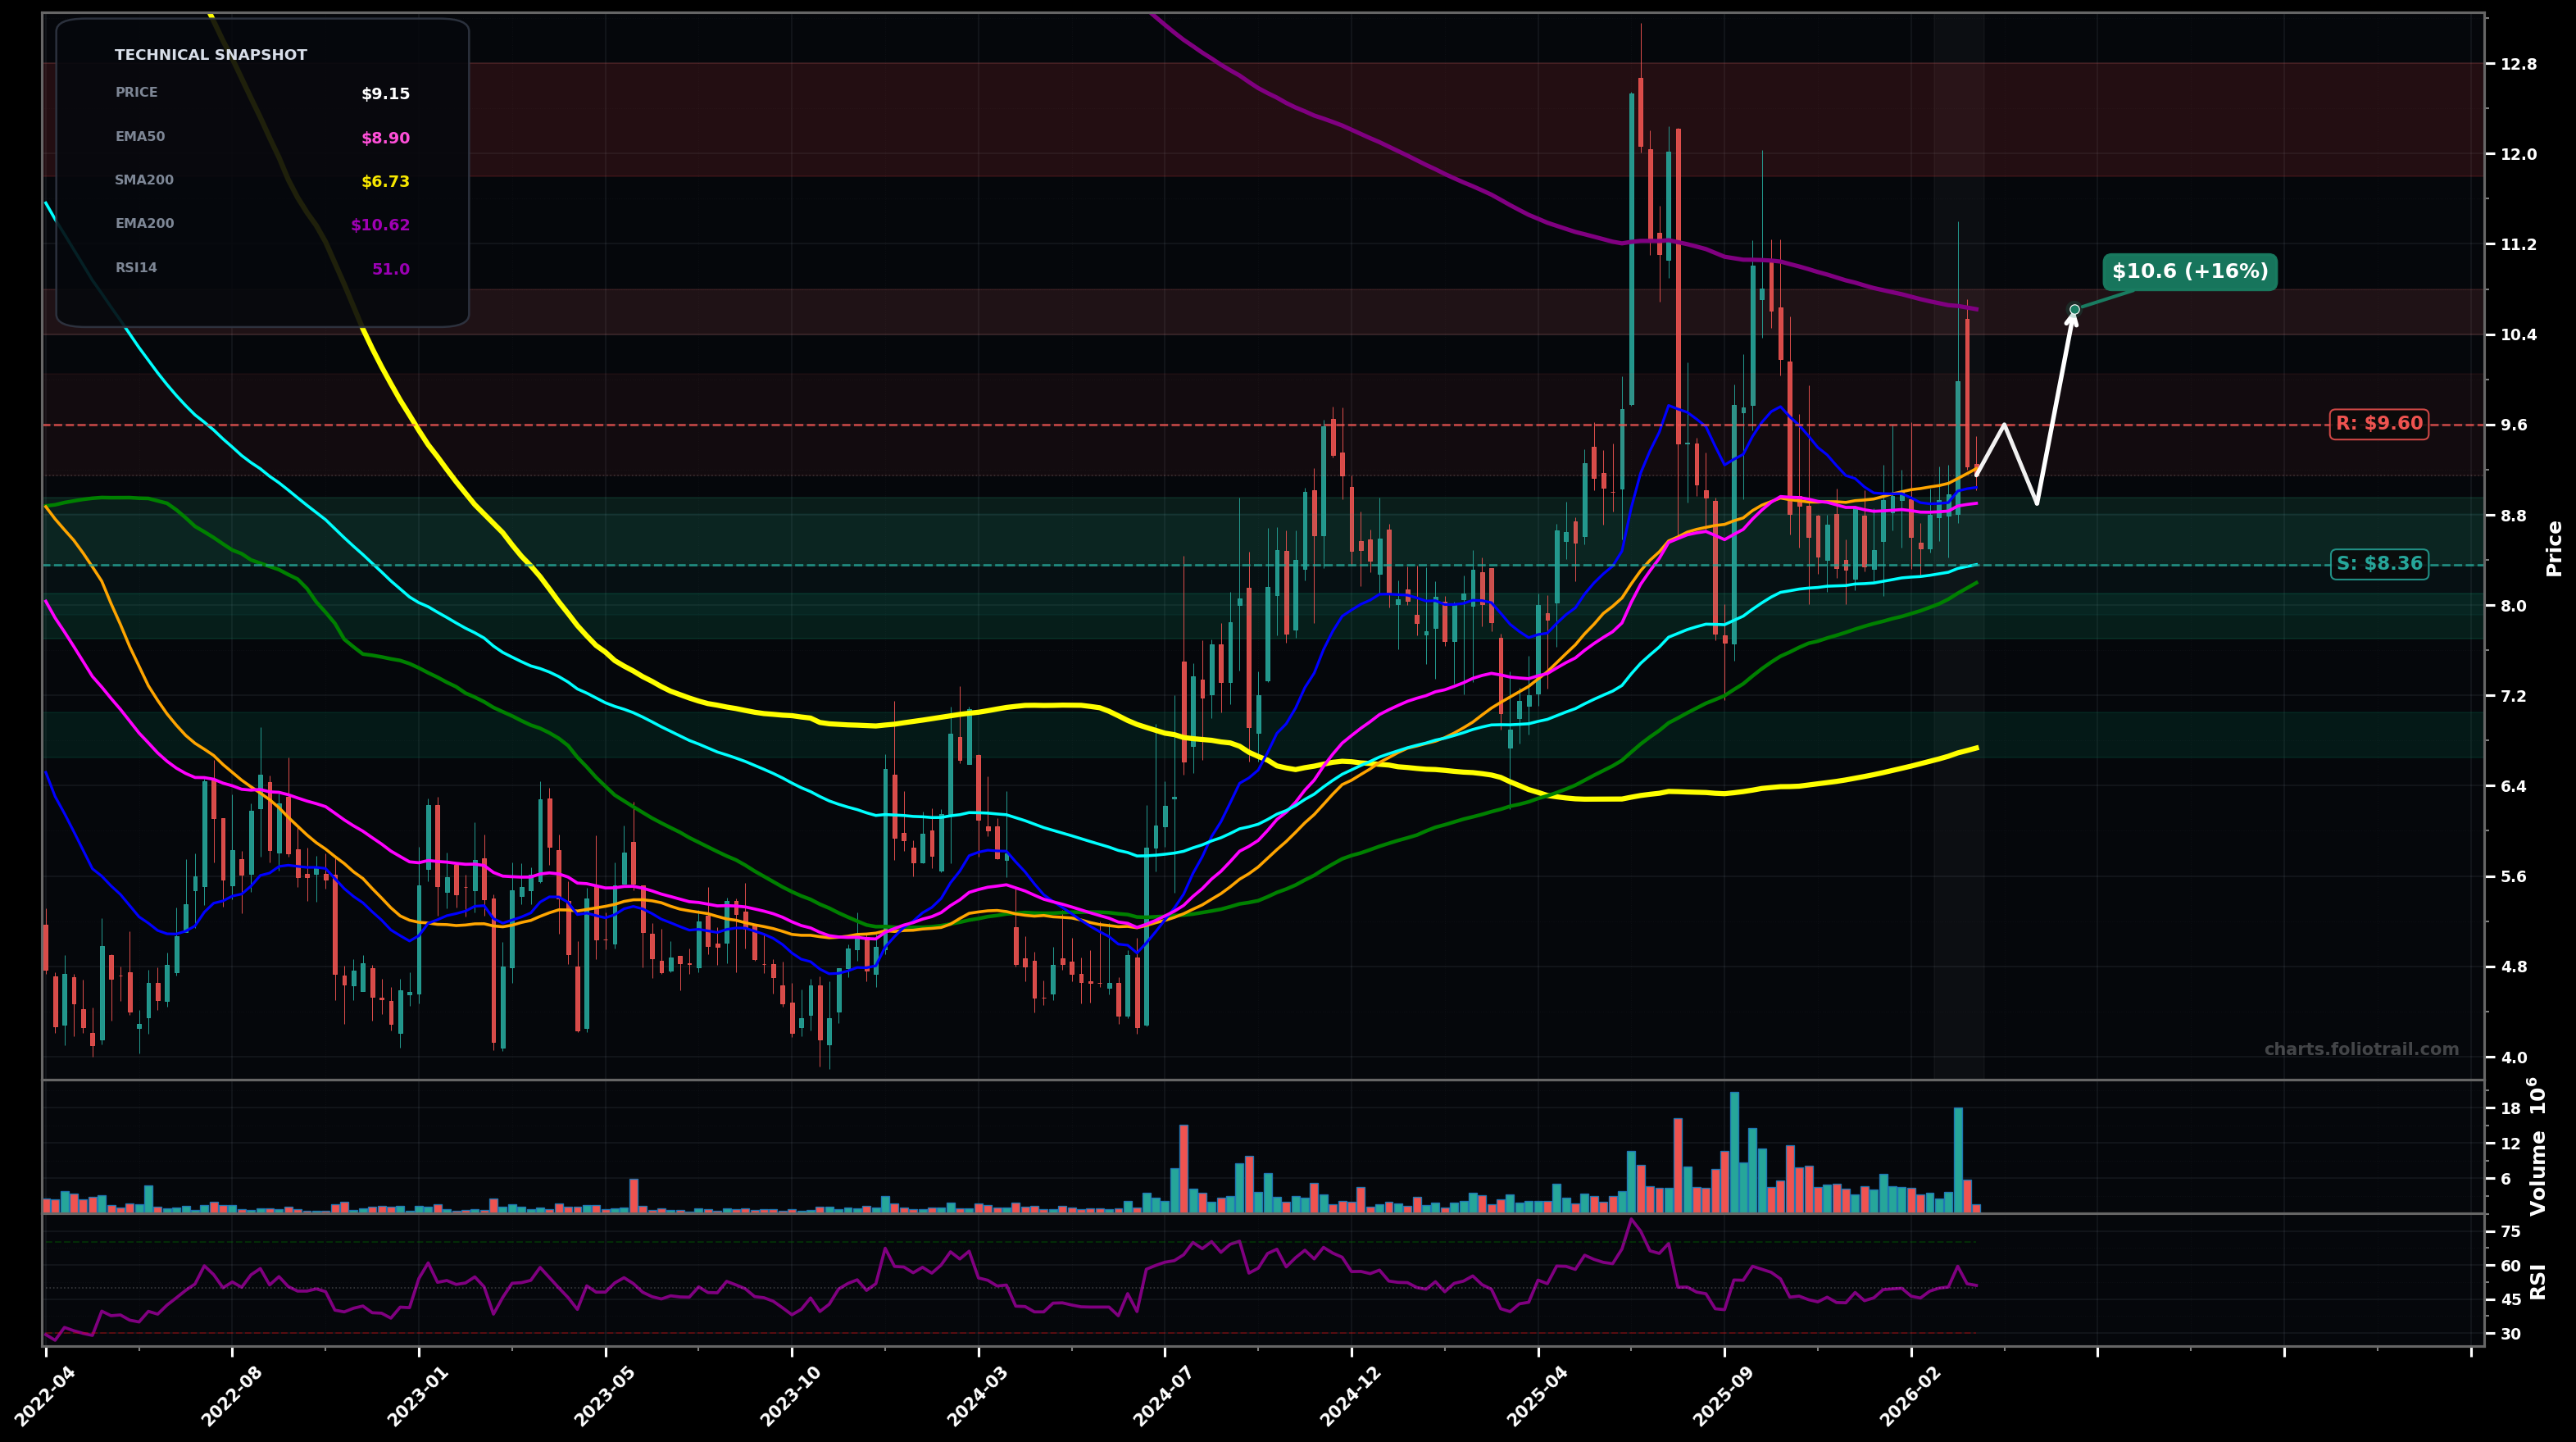
As of March 25, 2026, ZVRA (Zevra Therapeutics, Inc.) is in a choppy range state on the weekly chart, with a confidence level of 64%. Key support is at $8.36 and key resistance at $9.60. Weekly price around $9.15 is consolidating just above EMA50/EMA100 with RSI ~51 after a volatile spike and pullback; repeated wicks into the $10 area show supply.
Range resolves upward: hold above EMA50/EMA100, then grind to the prior supply zone; if $10.40 breaks, squeeze toward the larger MA overhead.
Bearish rejection: lose EMA100 and the range floor, triggering a deeper mean-reversion toward the rising long-term averages.
2+ weekly closes above $9.60 with follow-through toward $10.40
Weekly close below $8.36 (EMA100) shifting control back to sellers
Start near EMA50/EMA100 confluence; add on breakdown/retest of the range; heavy add near SMA200 ($6.73) where longer-term mean reversion/support is likely.
Trim into EMA200/major supply (~$10.6) then into the prior spike distribution ($12+); fully exit only on a large extension beyond prior extremes (fib-style blow-off).
As of March 25, 2026, ZVRA (Zevra Therapeutics, Inc.) is in a choppy range state on the weekly chart with 64% confidence. Weekly price around $9.15 is consolidating just above EMA50/EMA100 with RSI ~51 after a volatile spike and pullback; repeated wicks into the $10 area show supply.
On the weekly timeframe, ZVRA has key support at $8.36 and key resistance at $9.60. The most likely scenario (bullish) targets $9.60 and $10.6, with a revert level at $8.90.
ZVRA (Zevra Therapeutics, Inc.) is currently classified as choppy range on the weekly chart, with 64% confidence. Confirmation requires: 2+ weekly closes above $9.60 with follow-through toward $10.40 This would be invalidated by: Weekly close below $8.36 (EMA100) shifting control back to sellers
The most likely scenario (bullish) targets $9.60 and $10.6, with a revert level at $8.90. The alternative scenario (bearish) targets $7.90 and $6.73.
Multi-layer AI agents analyse 200+ stocks across daily, weekly, and monthly timeframes — producing market state classifications, price scenarios with targets, and position entry/exit levels. Updated every trading day after market close. No paywall. No sign-up required.
Built by Foliotrail.
All content on this website — including charts, analysis, price targets, support/resistance levels, and position zones — is generated entirely by AI and provided for educational and informational purposes only.
This is not financial advice. NEXUSNOIR VENTURES SL (the operator of this website) is not a registered investment adviser or broker-dealer. You should not make investment decisions based solely on this information. Always do your own research and consult a qualified financial advisor.
By continuing, you acknowledge that you have read and agree to our full disclaimer & terms of use and privacy policy.