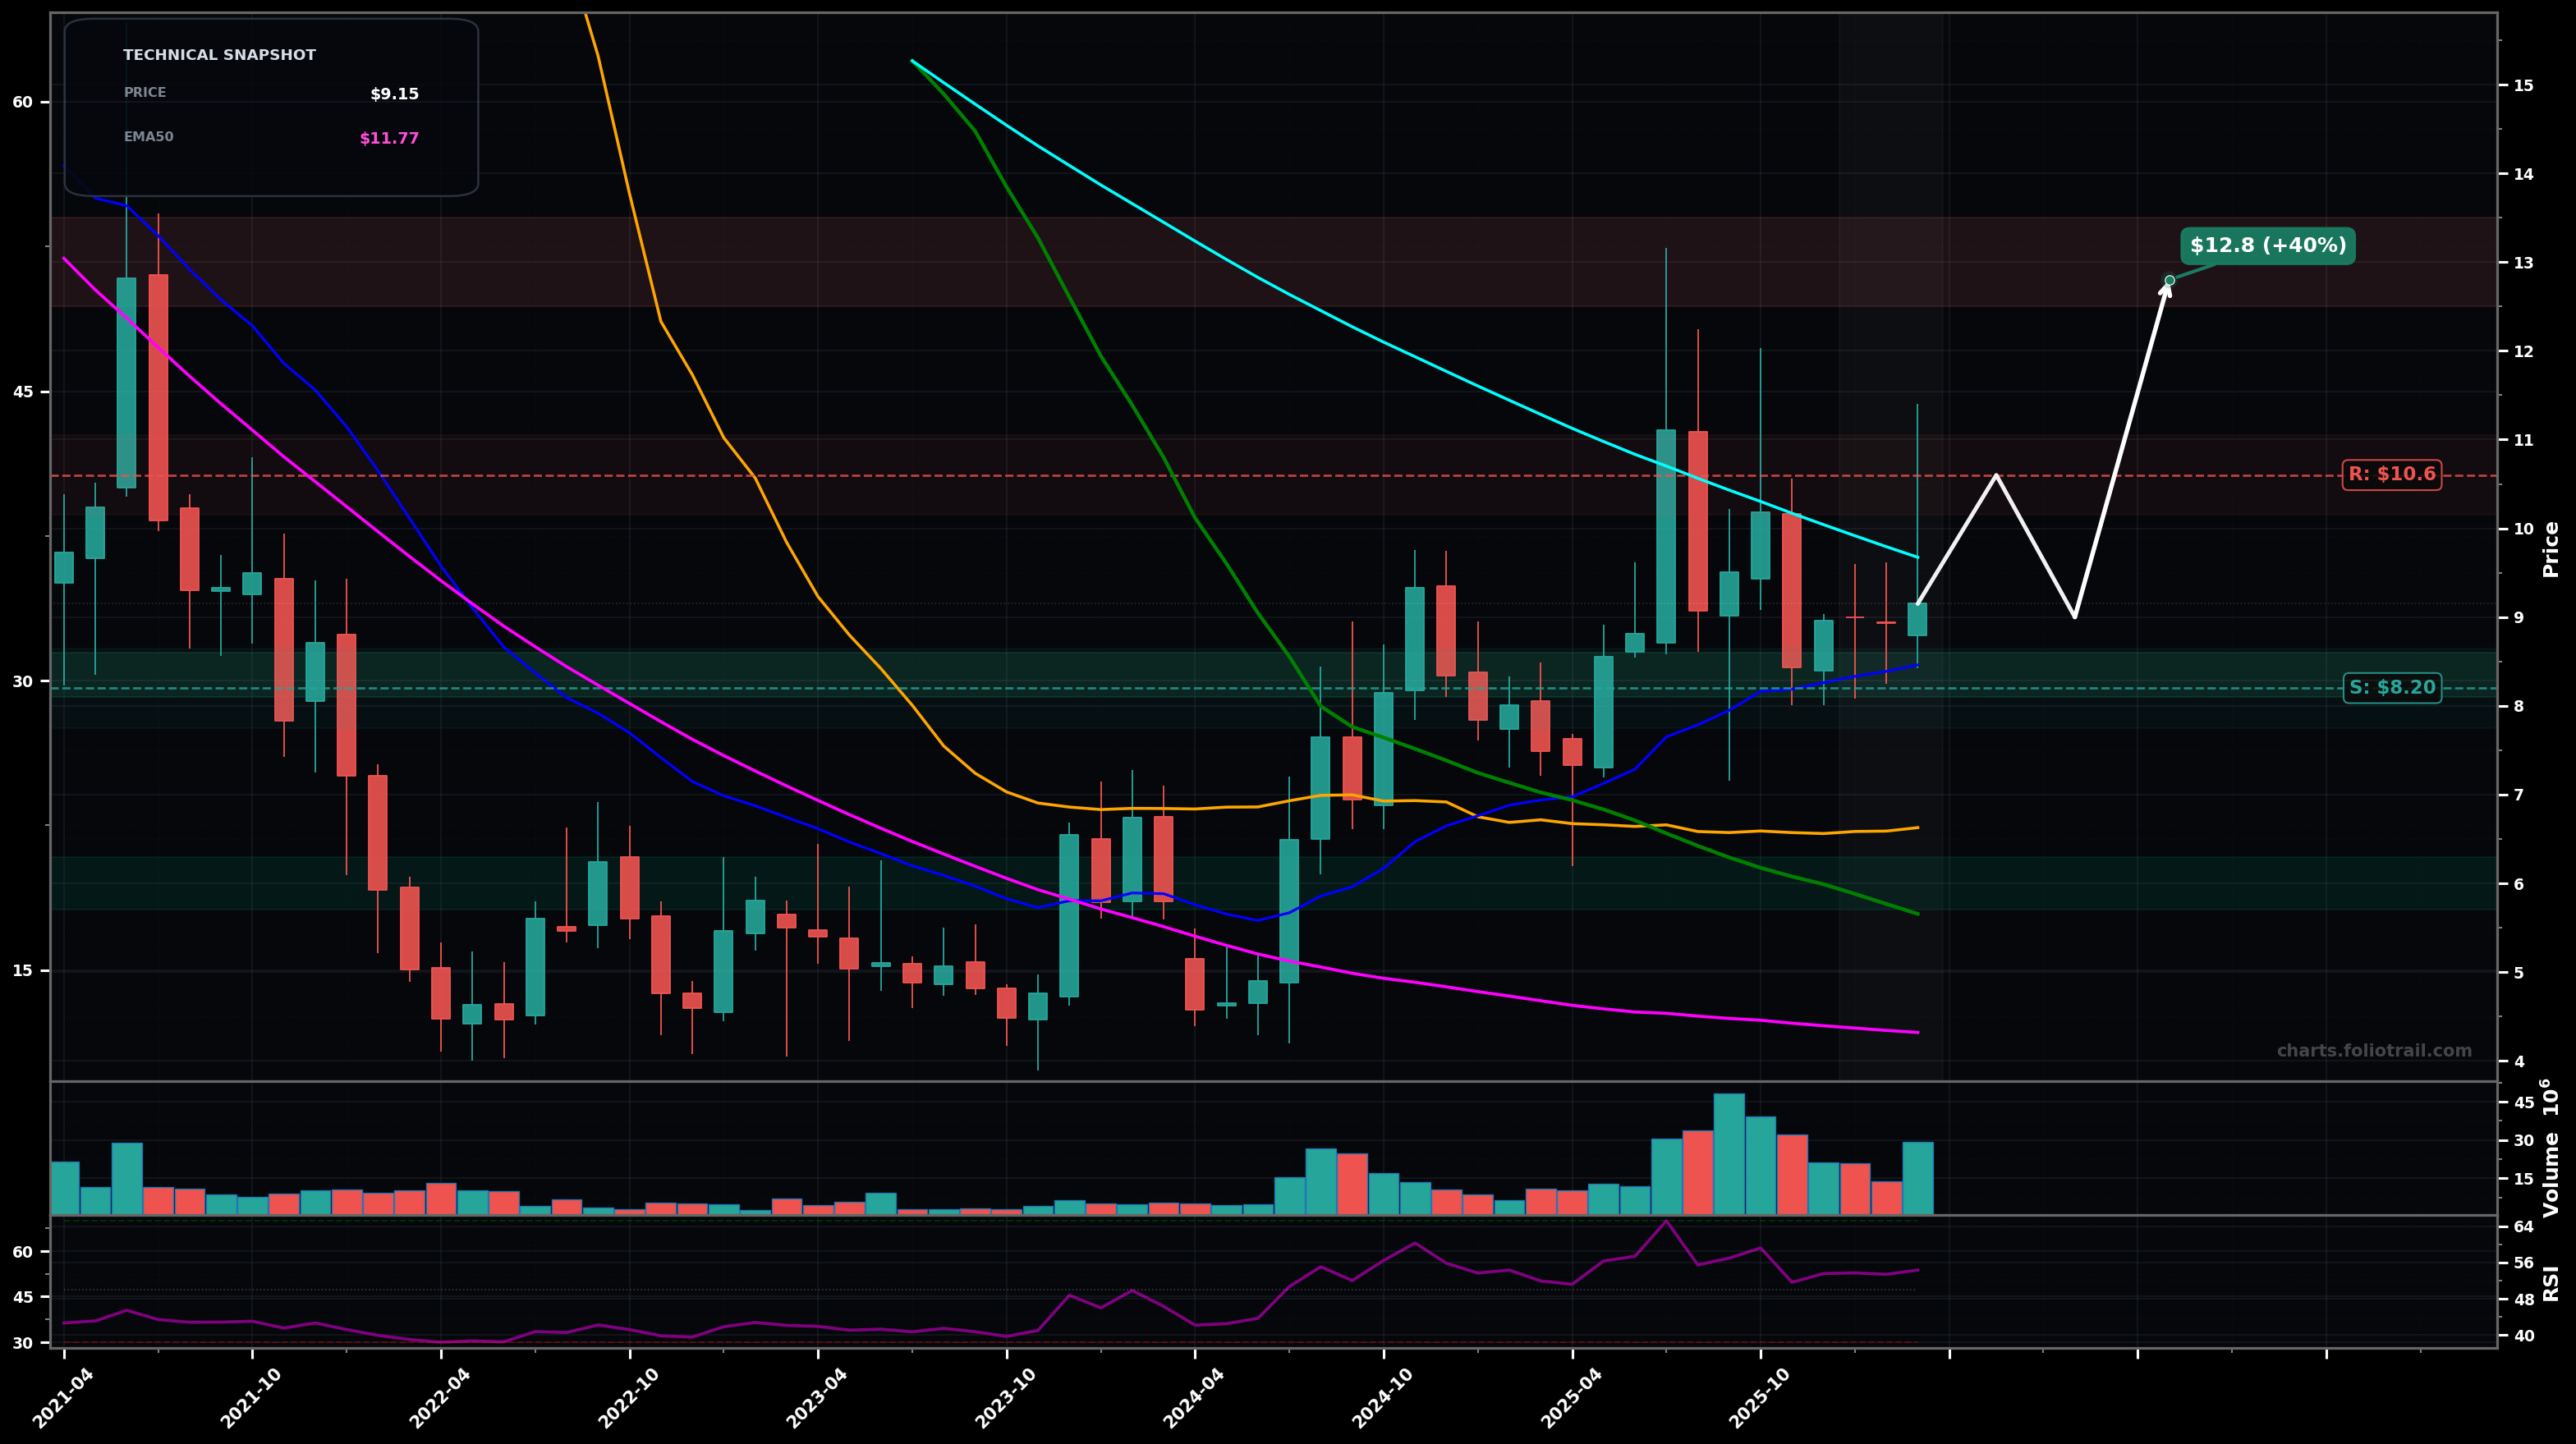
As of March 25, 2026, ZVRA (Zevra Therapeutics, Inc.) is in a bottoming attempt state on the monthly chart, with a confidence level of 63%. Key support is at $8.20 and key resistance at $10.6. Monthly price (~$9.15) is consolidating after a strong bounce, holding above the rising short-term average (SMA50 ~$6.63) but still capped by declining longer-term MAs (notably EMA100/EMA50 region overhead).
Range-to-up resolution: price holds $8.20 support, grinds higher, and tests the $10.60–$11.10 supply zone; if reclaimed, next leg targets the prior impulse peak area.
Failed base: rejection from $10.60 area and loss of $8.20 leads to a deeper pullback to the base floor (SMA50/previous pivots), with risk of a full retest of the prior swing-low zone.
Monthly close(s) above $10.60 with follow-through (2+ closes holding) would confirm the bottoming attempt shifting toward a breakout/reversal.
Monthly close below $7.80 would invalidate the higher-low/basing structure and re-open downside continuation risk.
Start near current pivot support (~$8.2); add on breakdown-to-support retest at prior base demand; heavy add only at deeper base/mean-reversion levels near multi-swing support.
Trim into major prior supply/volume zones and where price would be increasingly stretched vs the long-term declining MA cluster; full exit only if price returns to the old distribution region from the prior cycle.
As of March 25, 2026, ZVRA (Zevra Therapeutics, Inc.) is in a bottoming attempt state on the monthly chart with 63% confidence. Monthly price (~$9.15) is consolidating after a strong bounce, holding above the rising short-term average (SMA50 ~$6.63) but still capped by declining longer-term MAs (notably EMA100/EMA50 region overhead).
On the monthly timeframe, ZVRA has key support at $8.20 and key resistance at $10.6. The most likely scenario (bullish) targets $10.6 and $12.8, with a revert level at $9.00.
ZVRA (Zevra Therapeutics, Inc.) is currently classified as bottoming attempt on the monthly chart, with 63% confidence. Confirmation requires: Monthly close(s) above $10.60 with follow-through (2+ closes holding) would confirm the bottoming attempt shifting toward a breakout/reversal. This would be invalidated by: Monthly close below $7.80 would invalidate the higher-low/basing structure and re-open downside continuation risk.
The most likely scenario (bullish) targets $10.6 and $12.8, with a revert level at $9.00. The alternative scenario (bearish) targets $7.20 and $5.80.
Multi-layer AI agents analyse 200+ stocks across daily, weekly, and monthly timeframes — producing market state classifications, price scenarios with targets, and position entry/exit levels. Updated every trading day after market close. No paywall. No sign-up required.
Built by Foliotrail.
All content on this website — including charts, analysis, price targets, support/resistance levels, and position zones — is generated entirely by AI and provided for educational and informational purposes only.
This is not financial advice. NEXUSNOIR VENTURES SL (the operator of this website) is not a registered investment adviser or broker-dealer. You should not make investment decisions based solely on this information. Always do your own research and consult a qualified financial advisor.
By continuing, you acknowledge that you have read and agree to our full disclaimer & terms of use and privacy policy.