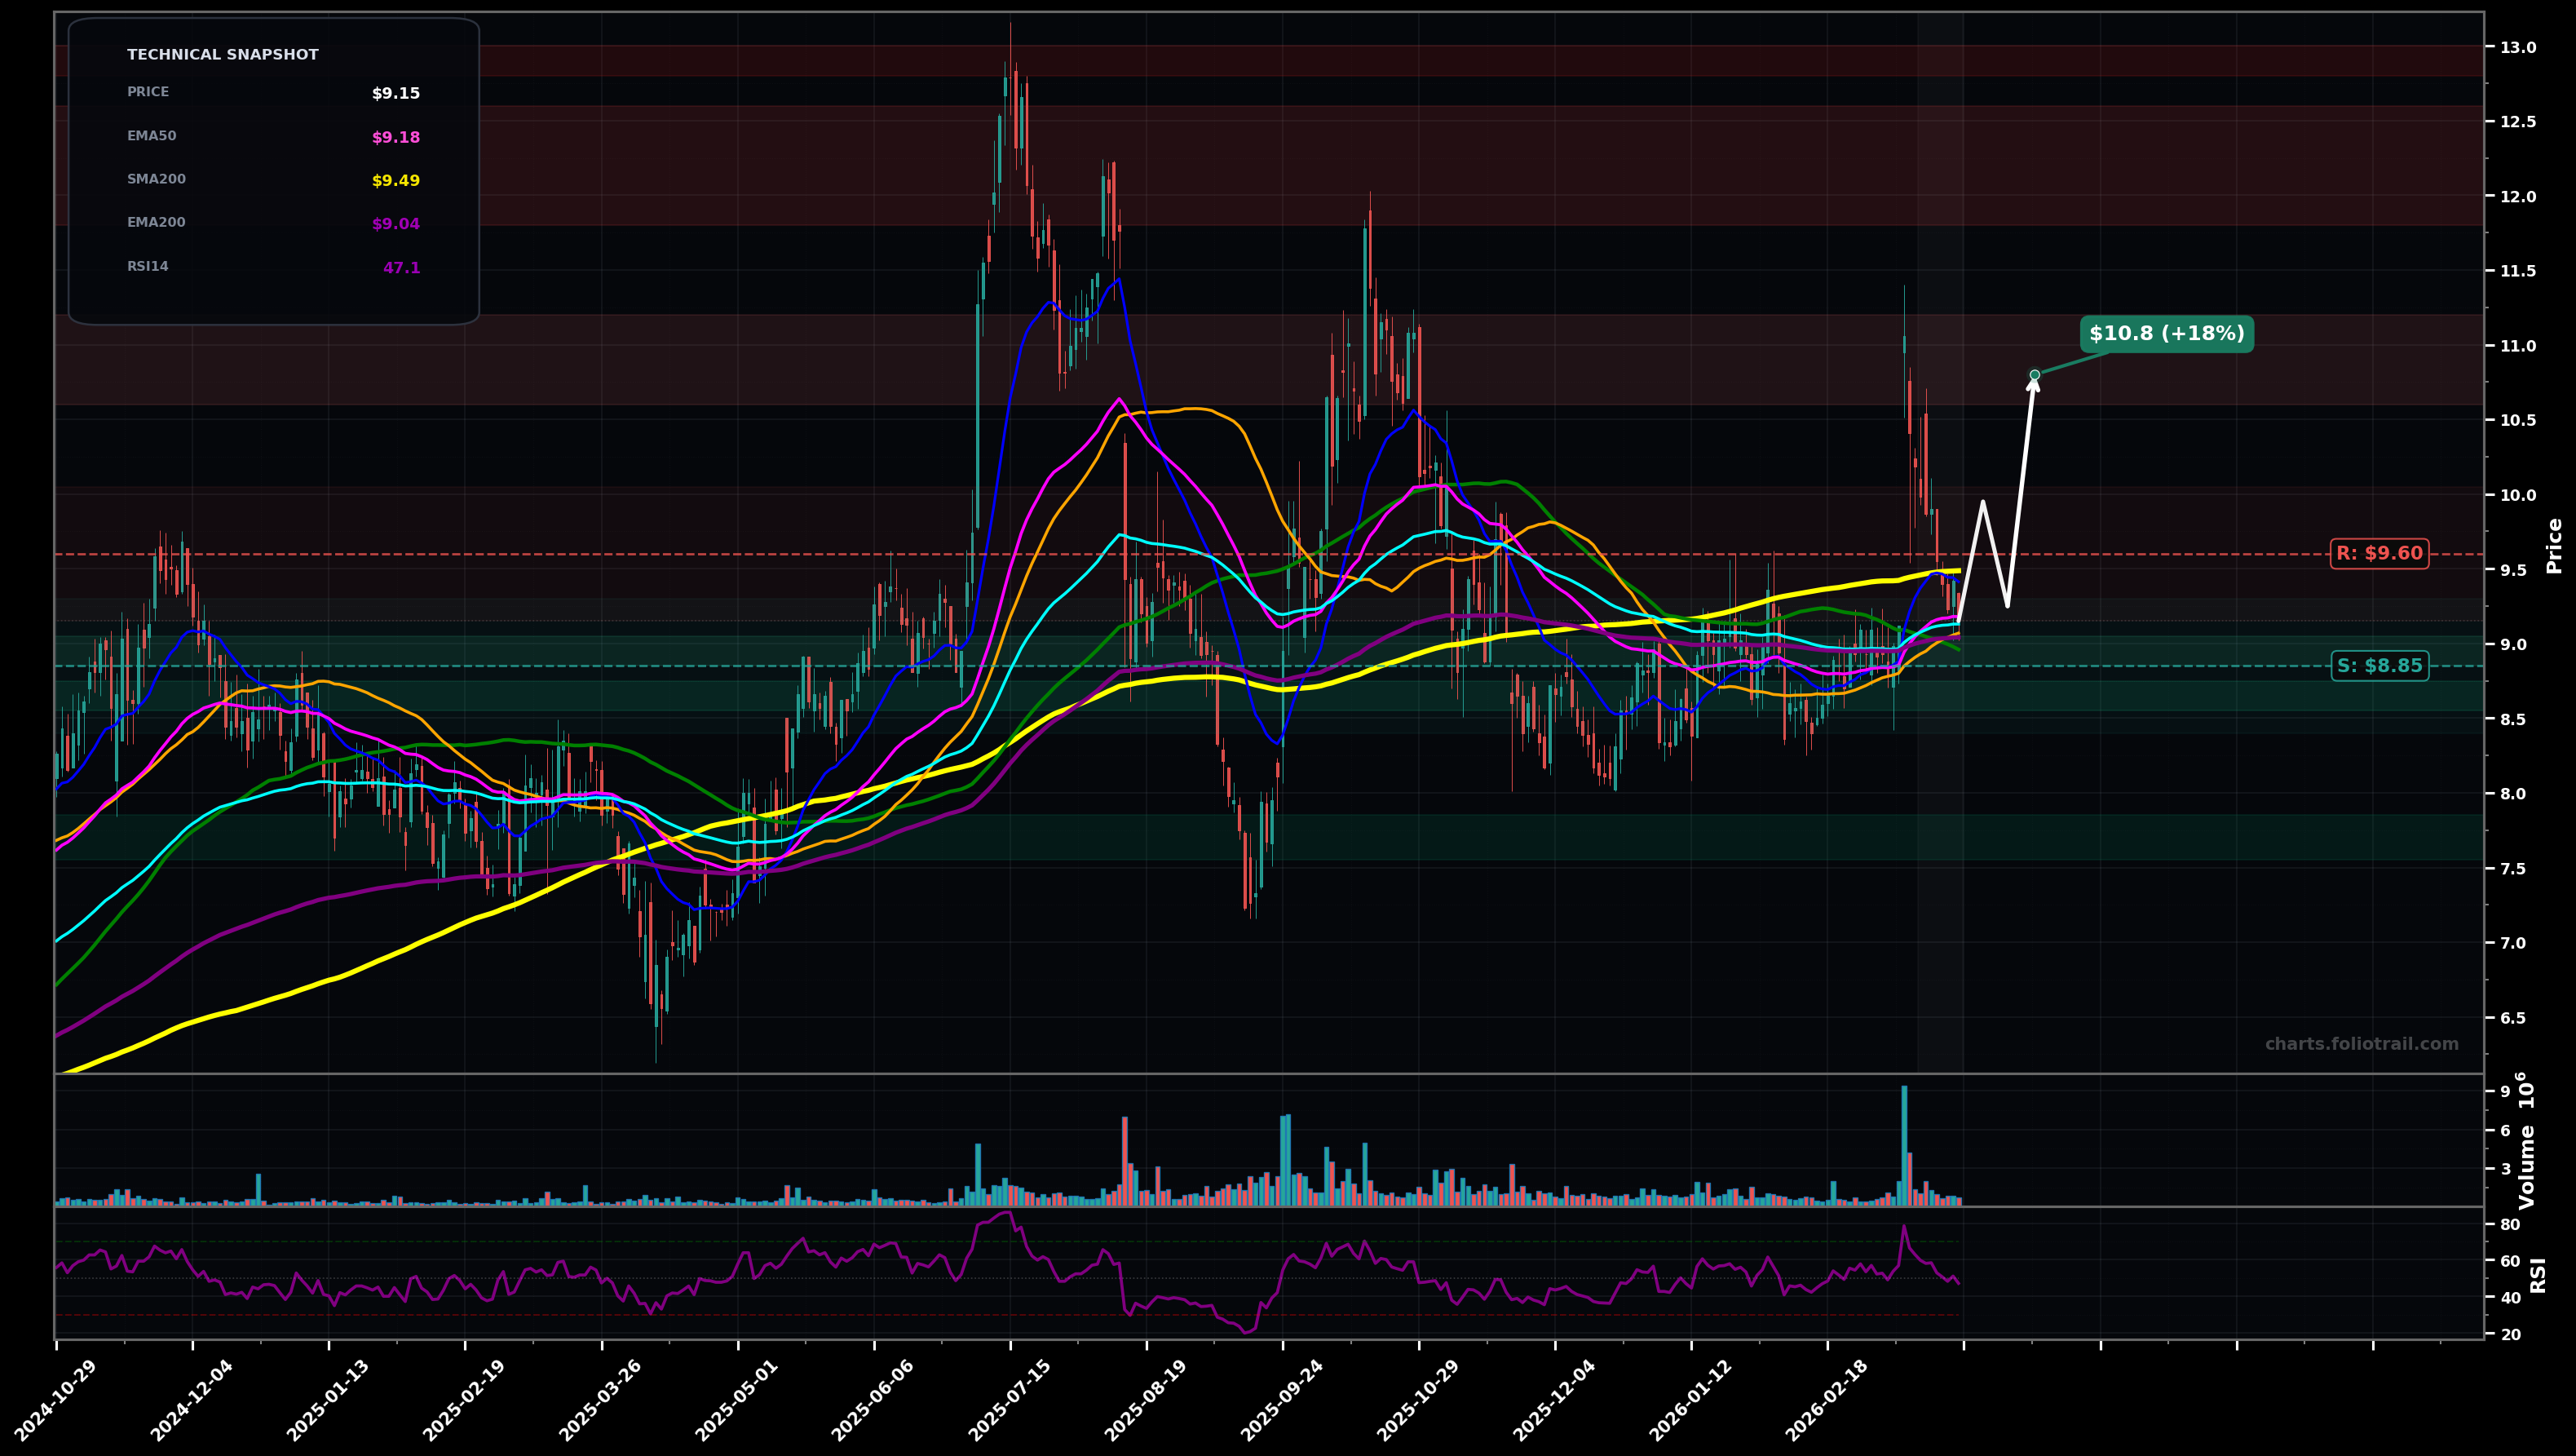
As of March 25, 2026, ZVRA (Zevra Therapeutics, Inc.) is in a choppy range state on the daily chart, with a confidence level of 64%. Key support is at $8.85 and key resistance at $9.60. Sharp gap/spike to ~$11 rejected; price quickly mean-reverted and is now sitting around the clustered MAs near ~$9.1 with RSI ~47.
Base holds and price grinds back above the MA cluster; a retest of the post-spike supply zone follows (range-to-up resolution).
Rejection persists under ~$9.60 and price loses the range floor; breakdown targets the prior swing demand area (range-to-down resolution).
2+ daily closes holding above $9.60 (reclaim/hold above the MA cluster and recent pivot zone)
Daily close below $8.60 (range floor breaks and opens a new LL leg)
Start near current demand/MA-cluster support; add on confirmed range-floor tests; heavy add only at prior swing-low demand if breakdown flushes.
Trim into the overhead supply created by the recent spike and the prior major swing-high zone; exit if price revisits the extreme top of the 1-year range.
As of March 25, 2026, ZVRA (Zevra Therapeutics, Inc.) is in a choppy range state on the daily chart with 64% confidence. Sharp gap/spike to ~$11 rejected; price quickly mean-reverted and is now sitting around the clustered MAs near ~$9.1 with RSI ~47.
On the daily timeframe, ZVRA has key support at $8.85 and key resistance at $9.60. The most likely scenario (bullish) targets $9.95 and $10.8, with a revert level at $9.25.
ZVRA (Zevra Therapeutics, Inc.) is currently classified as choppy range on the daily chart, with 64% confidence. Confirmation requires: 2+ daily closes holding above $9.60 (reclaim/hold above the MA cluster and recent pivot zone) This would be invalidated by: Daily close below $8.60 (range floor breaks and opens a new LL leg)
The most likely scenario (bullish) targets $9.95 and $10.8, with a revert level at $9.25. The alternative scenario (bearish) targets $8.60 and $7.60.
Multi-layer AI agents analyse 200+ stocks across daily, weekly, and monthly timeframes — producing market state classifications, price scenarios with targets, and position entry/exit levels. Updated every trading day after market close. No paywall. No sign-up required.
Built by Foliotrail.
All content on this website — including charts, analysis, price targets, support/resistance levels, and position zones — is generated entirely by AI and provided for educational and informational purposes only.
This is not financial advice. NEXUSNOIR VENTURES SL (the operator of this website) is not a registered investment adviser or broker-dealer. You should not make investment decisions based solely on this information. Always do your own research and consult a qualified financial advisor.
By continuing, you acknowledge that you have read and agree to our full disclaimer & terms of use and privacy policy.