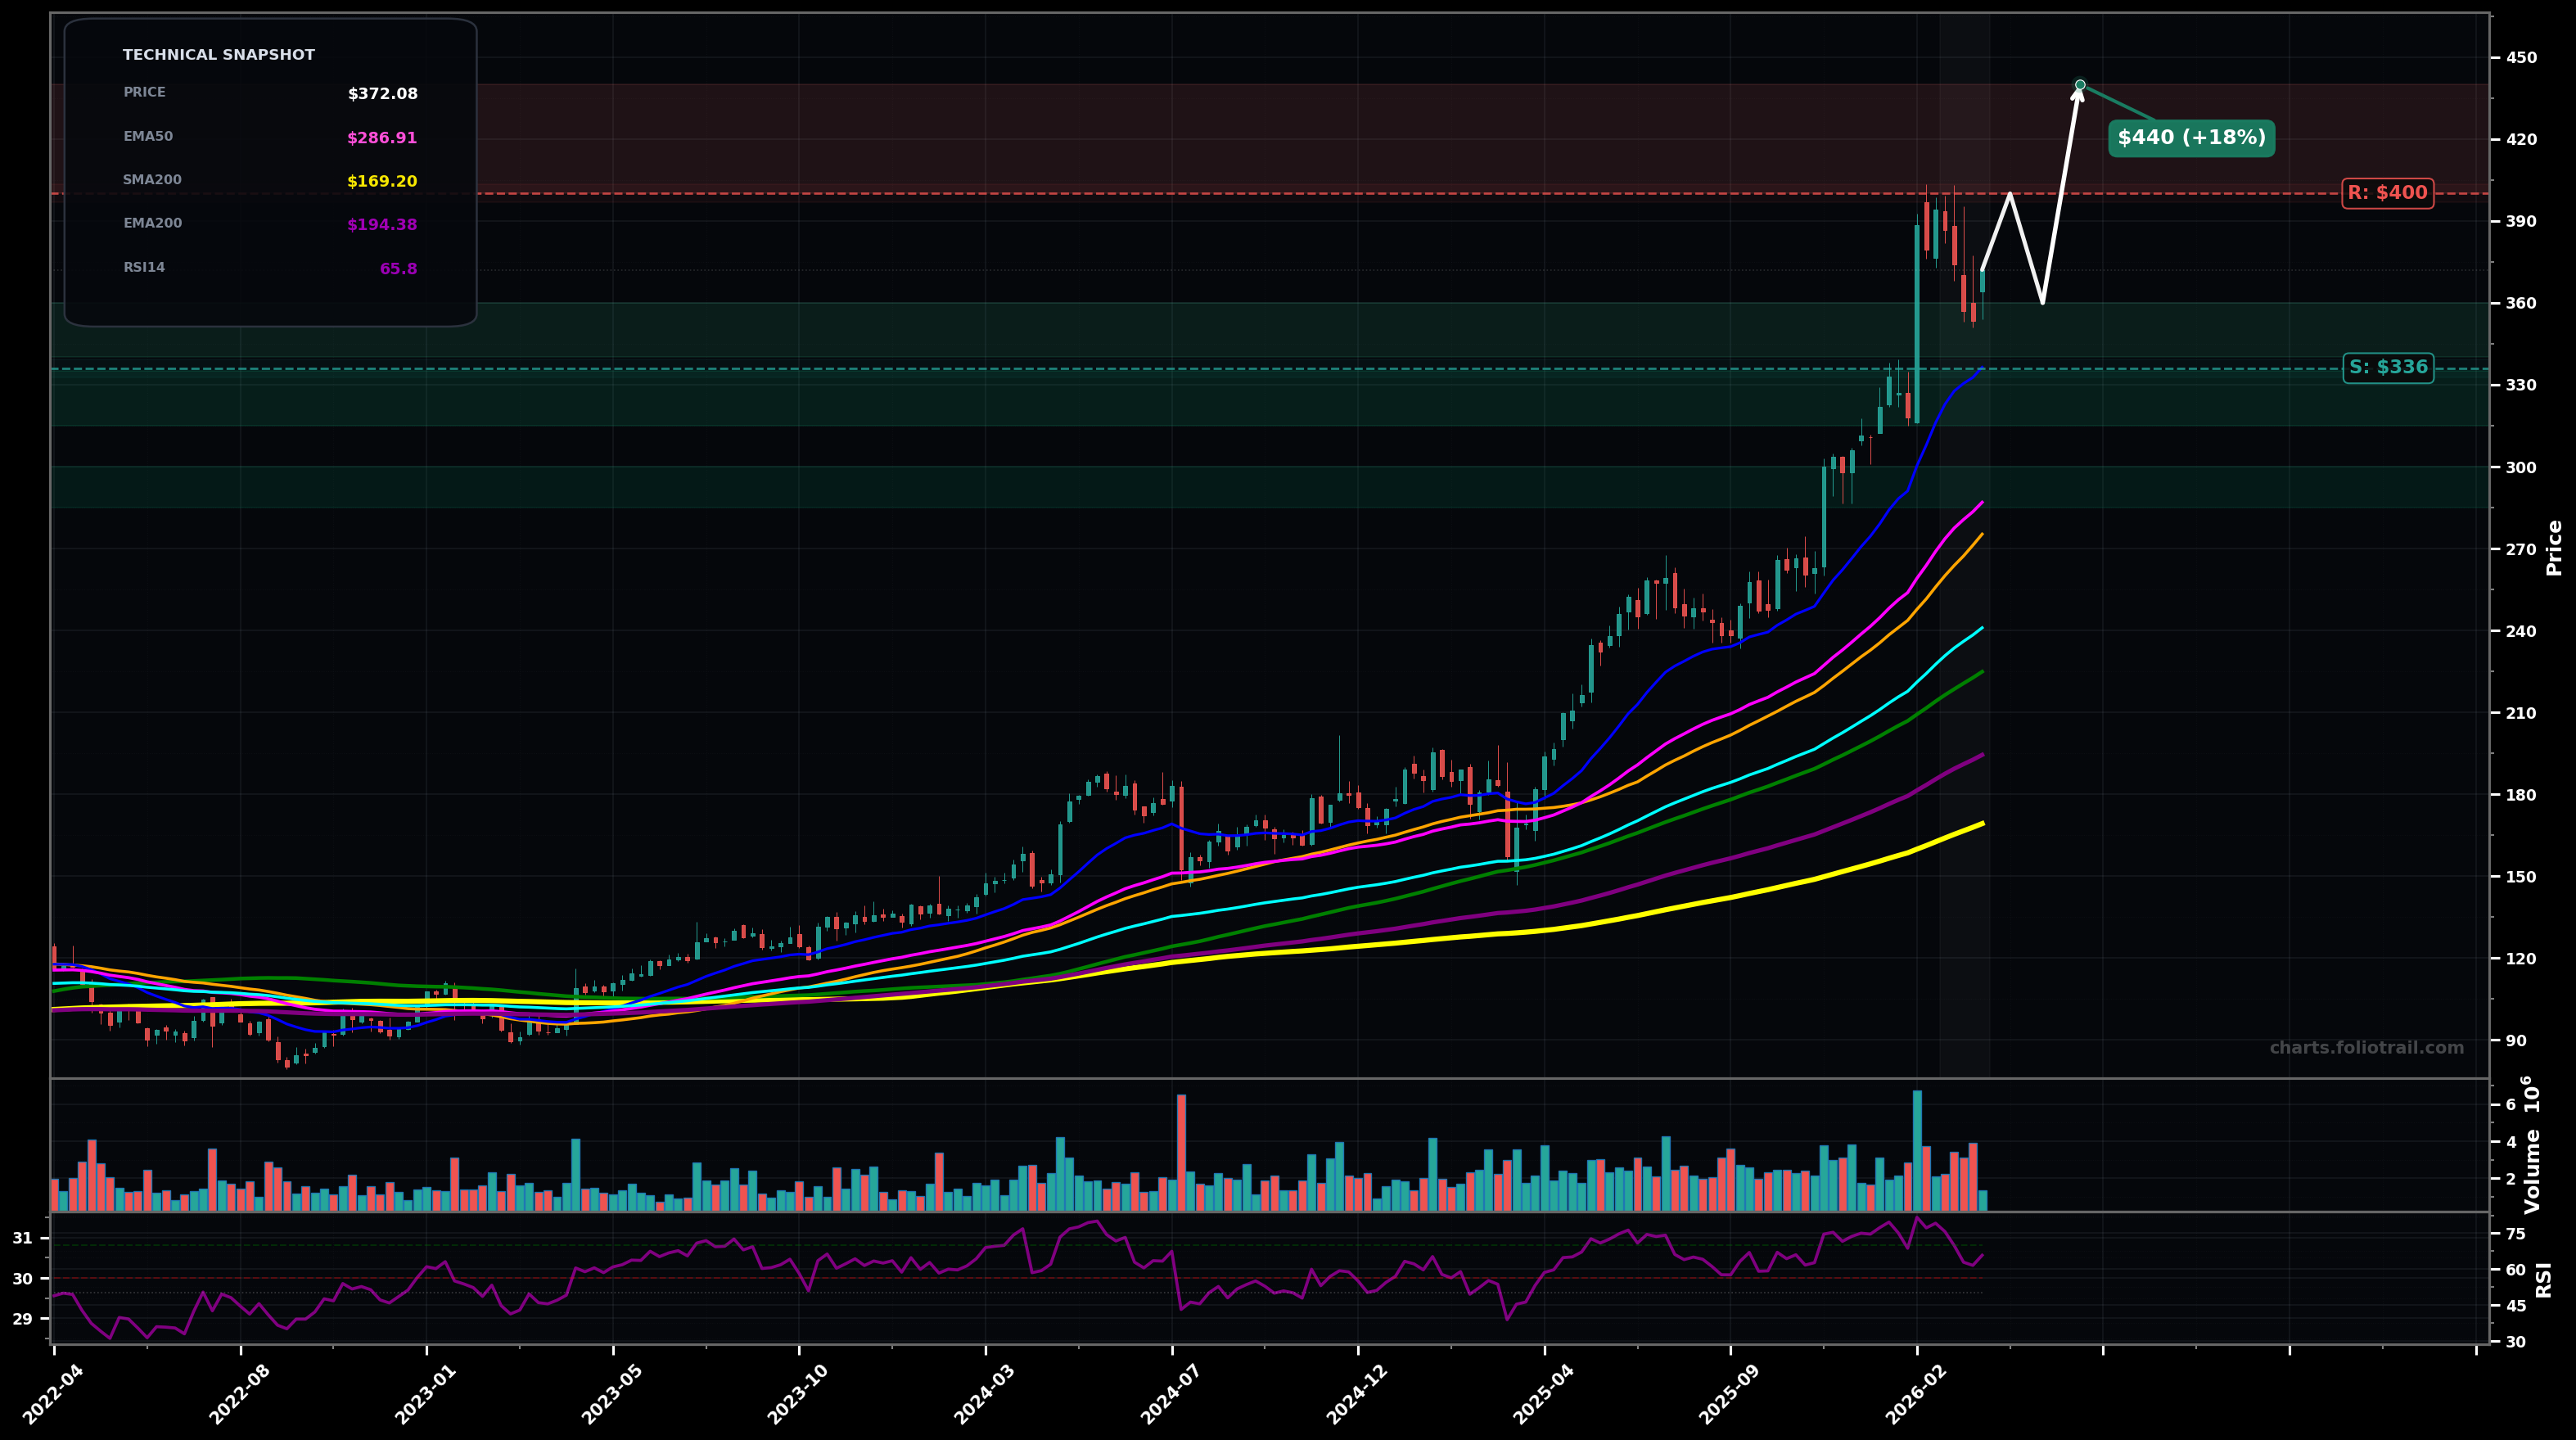
As of March 26, 2026, WWD (Woodward Inc.) is in a uptrend state on the weekly chart, with a confidence level of 78%. Key support is at $336 and key resistance at $400. Strong HH/HL advance followed by a sharp breakout spike toward ~$400, then a pullback/flag holding well above rising EMA50; RSI ~66 still bullish.
Bullish continuation: pullback finishes as a Wave 4-style consolidation, then price re-accelerates in Wave 5 toward the prior high and a measured extension; first a reclaim of the ~$390 area, then new highs.
Deeper correction: the post-spike move resolves as an ABC down (or larger Wave 4), breaking below EMA20 and mean-reverting toward EMA50; buyers likely defend the ~$320–$300 region before any renewed uptrend attempt.
Weekly close back above $390 (reclaim of the post-spike supply zone) would confirm trend continuation.
Weekly close below $336 (EMA20 area / recent swing support) would invalidate the current bullish continuation read and signal deeper correction risk.
Start near EMA20/swing support, add on a controlled pullback toward the mid-channel/38.2–50% retrace zone, heavy add near EMA50 (pink) and prior breakout base where trend buyers typically defend.
Trim into prior-high supply ($400+) and potential Wave-5/Fib extension zone; increase trimming if price gets increasingly stretched vs EMA50/EMA100; close more aggressively into larger extension blow-off risk.
As of March 26, 2026, WWD (Woodward Inc.) is in a uptrend state on the weekly chart with 78% confidence. Strong HH/HL advance followed by a sharp breakout spike toward ~$400, then a pullback/flag holding well above rising EMA50; RSI ~66 still bullish.
On the weekly timeframe, WWD has key support at $336 and key resistance at $400. The most likely scenario (bullish) targets $400 and $440, with a revert level at $360.
WWD (Woodward Inc.) is currently classified as uptrend on the weekly chart, with 78% confidence. Confirmation requires: Weekly close back above $390 (reclaim of the post-spike supply zone) would confirm trend continuation. This would be invalidated by: Weekly close below $336 (EMA20 area / recent swing support) would invalidate the current bullish continuation read and signal deeper correction risk.
The most likely scenario (bullish) targets $400 and $440, with a revert level at $360. The alternative scenario (bearish) targets $320 and $286.
Multi-layer AI agents analyse 200+ stocks across daily, weekly, and monthly timeframes — producing market state classifications, price scenarios with targets, and position entry/exit levels. Updated every trading day after market close. No paywall. No sign-up required.
Built by Foliotrail.
All content on this website — including charts, analysis, price targets, support/resistance levels, and position zones — is generated entirely by AI and provided for educational and informational purposes only.
This is not financial advice. NEXUSNOIR VENTURES SL (the operator of this website) is not a registered investment adviser or broker-dealer. You should not make investment decisions based solely on this information. Always do your own research and consult a qualified financial advisor.
By continuing, you acknowledge that you have read and agree to our full disclaimer & terms of use and privacy policy.