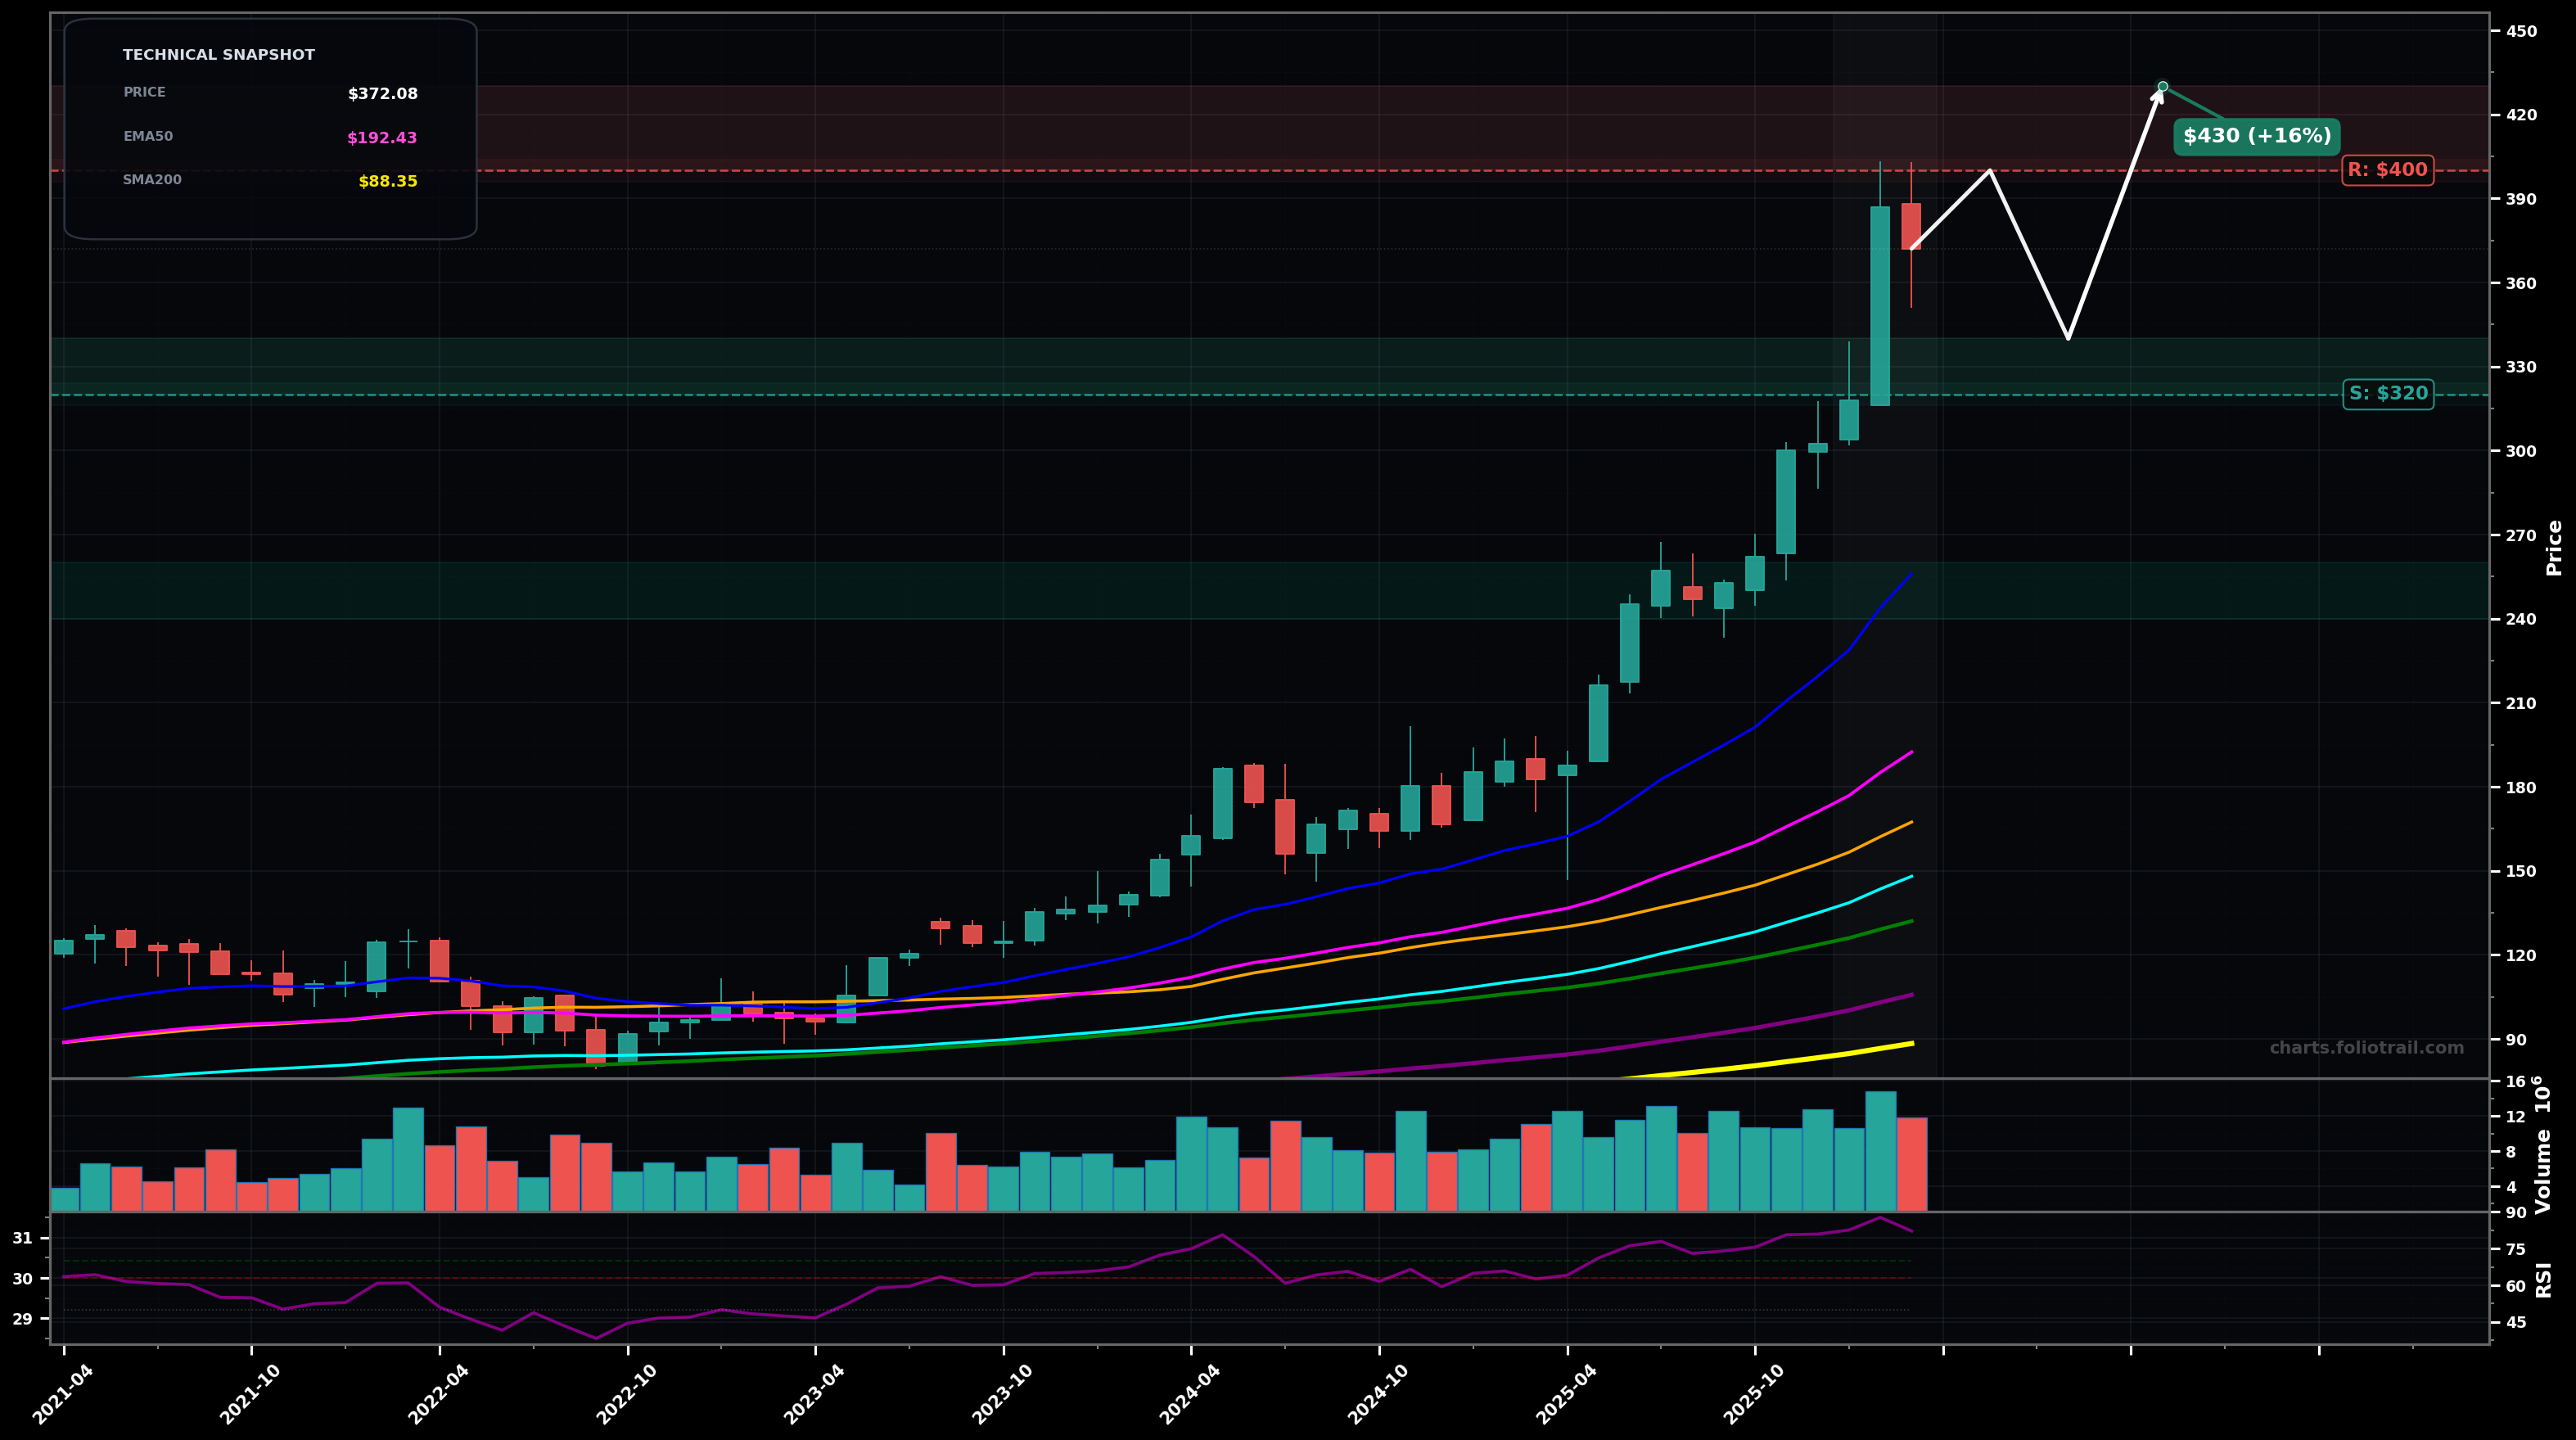
As of March 26, 2026, WWD (Woodward Inc.) is in a parabolic state on the monthly chart, with a confidence level of 78%. Key support is at $320 and key resistance at $400. Strong multi-month rally accelerated into a near-vertical push to ~$400, followed by a small pullback/inside-type red candle; price remains far above all key MAs with RSI extremely overbought.
Momentum cool-off then continuation: a controlled pullback/sideways digestion above prior breakout zone (~$320–$340), then another attempt to break $400.
Parabolic unwind: rejection near $400 leads to a deeper mean-reversion toward the fast trend anchors (EMA20/EMA50 area), potentially forming a larger monthly consolidation before trend resumes.
Monthly close above $400 with follow-through to hold above $375 on the next close
Monthly close below $320 (break of most recent swing-low area and momentum regime shift)
Buy-the-dip plan anchored to prior breakout/swing structure ($320–$340), then Fibonacci-style deeper retrace zones toward EMA20/EMA50 confluence if volatility expands.
Parabolic + RSI>80 implies elevated reversal risk; trim into extensions above the $400 psychological level and further fib-extension zones if price stays far above EMA50/EMA100.
As of March 26, 2026, WWD (Woodward Inc.) is in a parabolic state on the monthly chart with 78% confidence. Strong multi-month rally accelerated into a near-vertical push to ~$400, followed by a small pullback/inside-type red candle; price remains far above all key MAs with RSI extremely overbought.
On the monthly timeframe, WWD has key support at $320 and key resistance at $400. The most likely scenario (bullish) targets $400 and $430, with a revert level at $340.
WWD (Woodward Inc.) is currently classified as parabolic on the monthly chart, with 78% confidence. Confirmation requires: Monthly close above $400 with follow-through to hold above $375 on the next close This would be invalidated by: Monthly close below $320 (break of most recent swing-low area and momentum regime shift)
The most likely scenario (bullish) targets $400 and $430, with a revert level at $340. The alternative scenario (bearish) targets $300 and $250.
Multi-layer AI agents analyse 200+ stocks across daily, weekly, and monthly timeframes — producing market state classifications, price scenarios with targets, and position entry/exit levels. Updated every trading day after market close. No paywall. No sign-up required.
Built by Foliotrail.
All content on this website — including charts, analysis, price targets, support/resistance levels, and position zones — is generated entirely by AI and provided for educational and informational purposes only.
This is not financial advice. NEXUSNOIR VENTURES SL (the operator of this website) is not a registered investment adviser or broker-dealer. You should not make investment decisions based solely on this information. Always do your own research and consult a qualified financial advisor.
By continuing, you acknowledge that you have read and agree to our full disclaimer & terms of use and privacy policy.