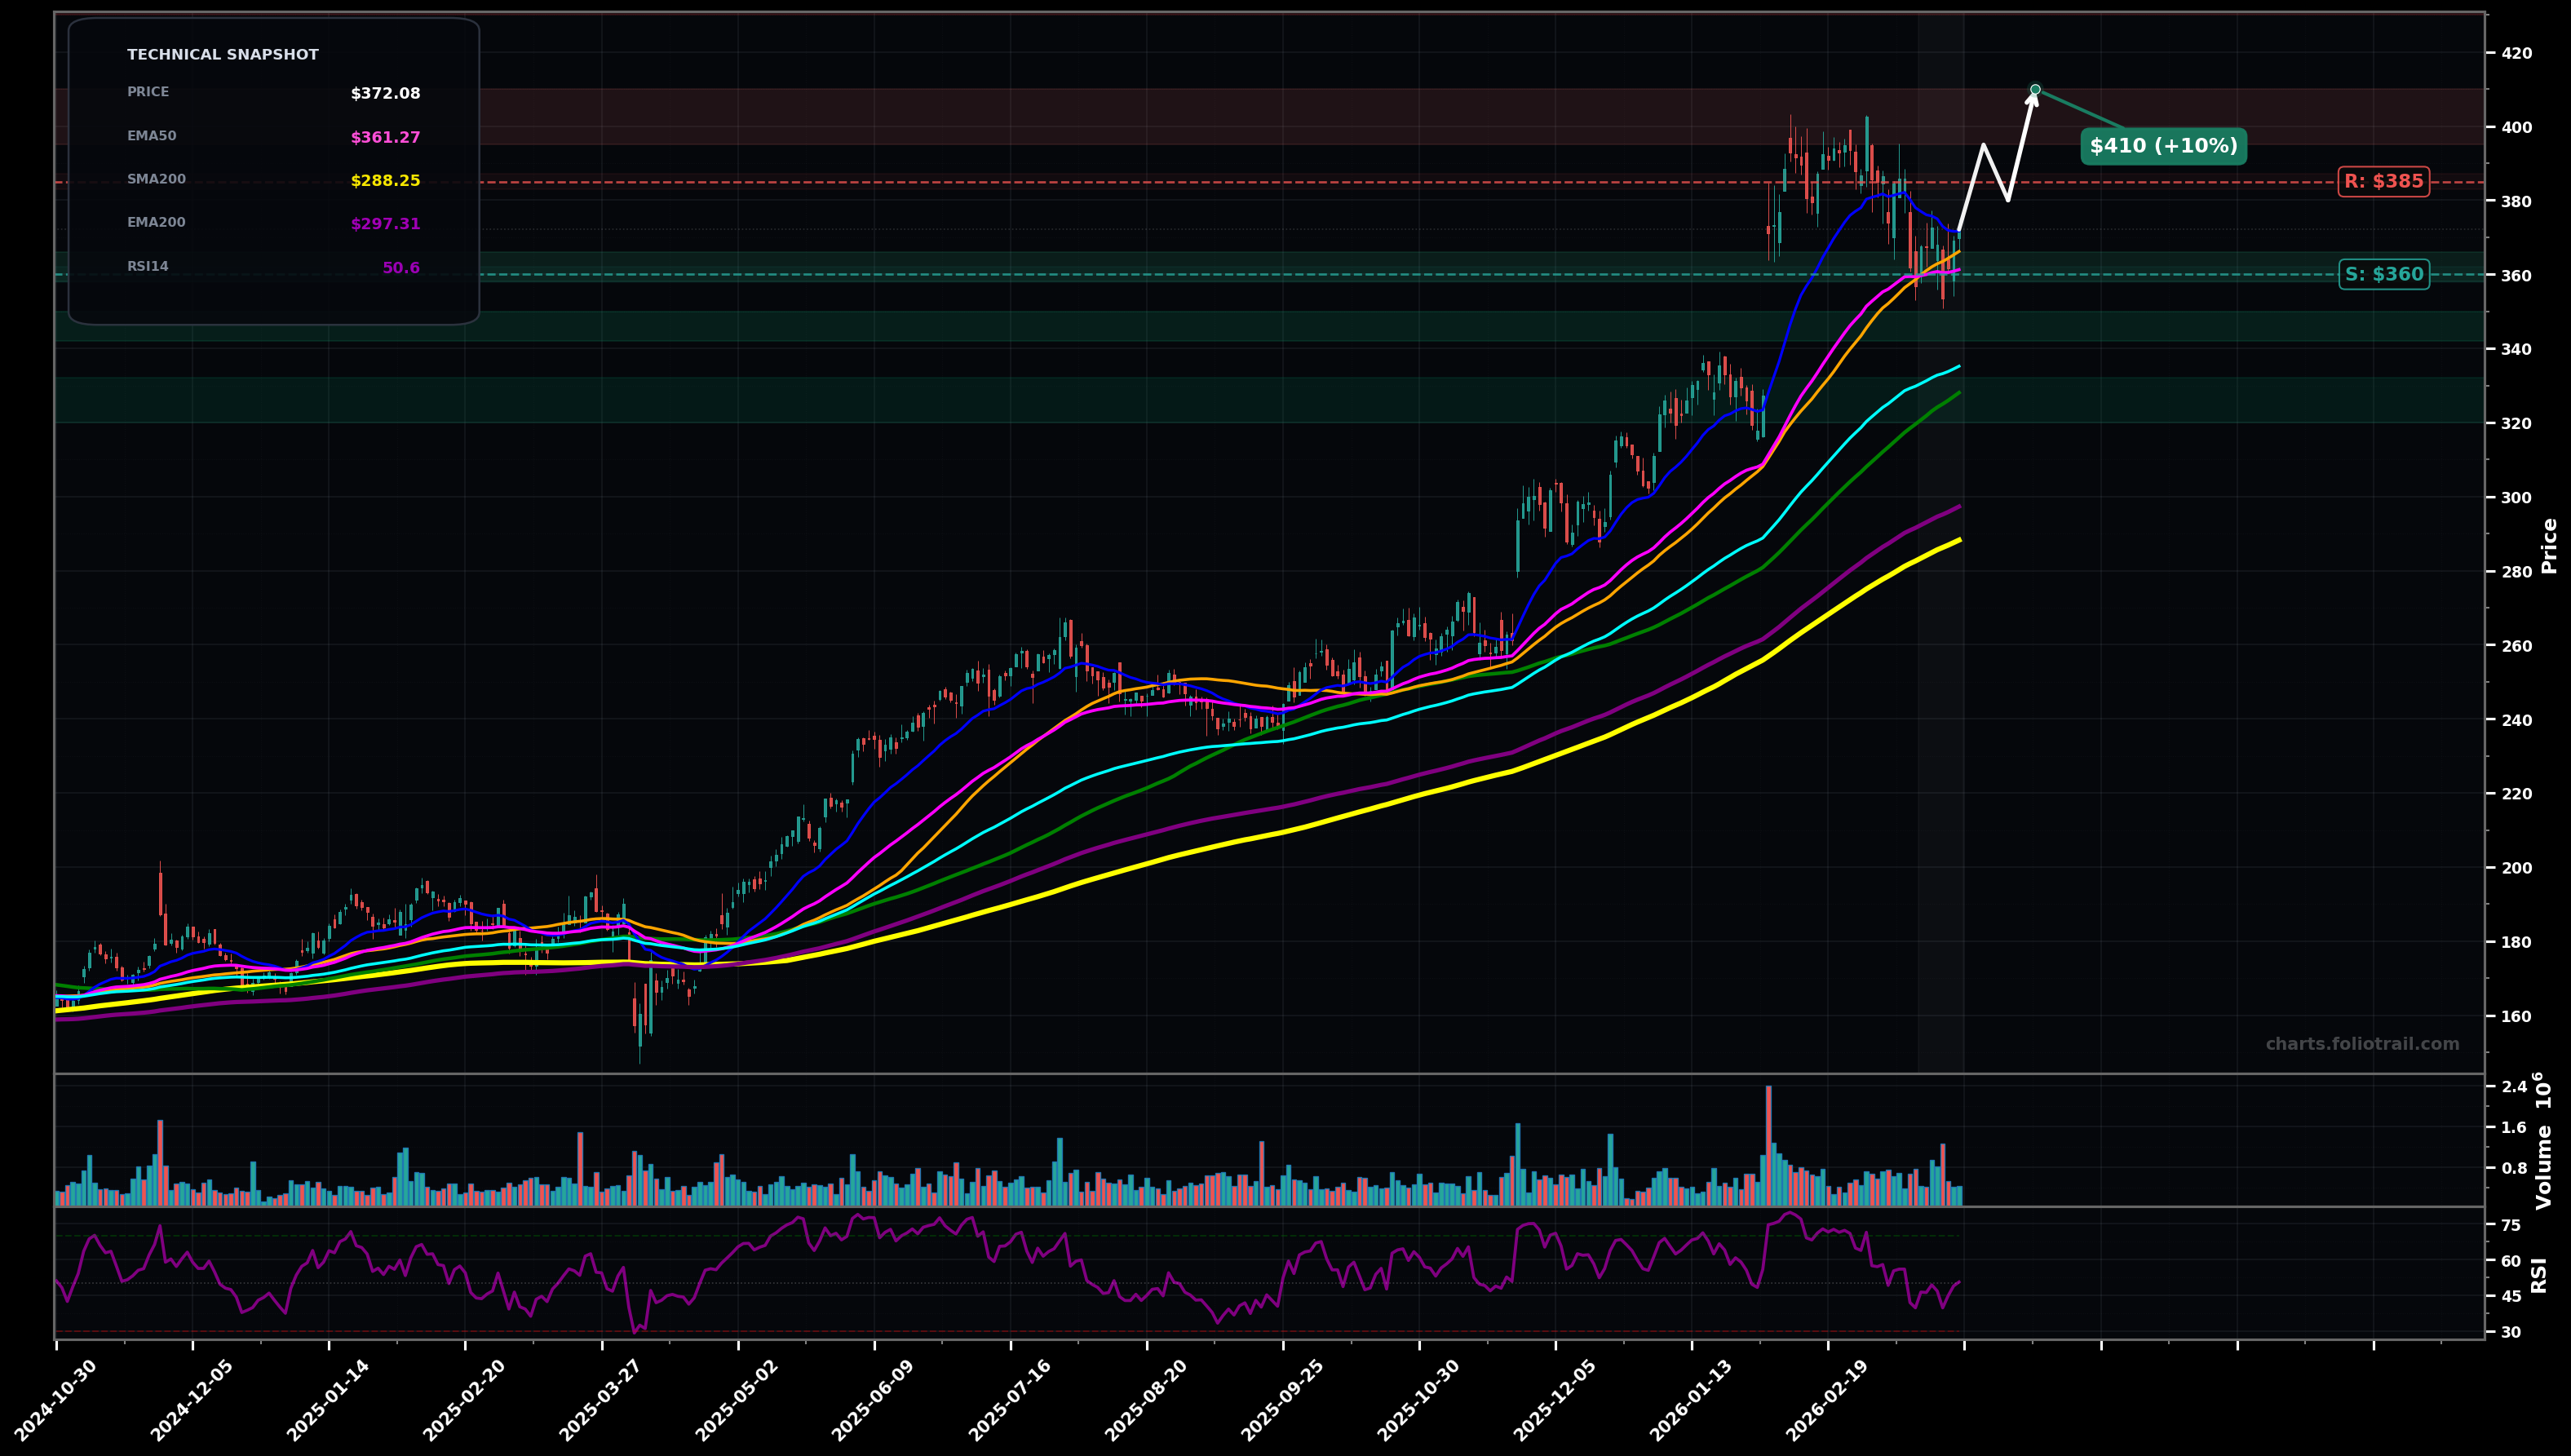
As of March 26, 2026, WWD (Woodward Inc.) is in a choppy range state on the daily chart, with a confidence level of 64%. Key support is at $360 and key resistance at $385. After topping near $395–$400, price pulled back and is now consolidating around $372 with MAs catching up; RSI ~50 suggests momentum reset.
Range resolves higher: hold above $360, reclaim $375–$380, then breakout through $385 with a retest that holds (bull flag/handle type continuation within the broader uptrend).
Breakdown from consolidation: lose $360, trigger a deeper mean-reversion toward the rising mid/long MAs (EMA100/SMA100 area) before attempting a base.
2+ daily closes above $385 would confirm a breakout attempt out of the range
Daily close below $360 would invalidate the range-hold thesis and shift bias to a deeper pullback
Start near range support ($360) with defined risk; add into EMA100/SMA100 confluence (~$335–$350); heavy add near SMA100 (~$328) / deeper Fib retrace zone if the pullback extends.
Trim into prior ATH/extension ($395–$410); heavier trims on Fib extensions above the prior peak; full exit only on multi-year stretch/overextension well above all major MAs.
As of March 26, 2026, WWD (Woodward Inc.) is in a choppy range state on the daily chart with 64% confidence. After topping near $395–$400, price pulled back and is now consolidating around $372 with MAs catching up; RSI ~50 suggests momentum reset.
On the daily timeframe, WWD has key support at $360 and key resistance at $385. The most likely scenario (bullish) targets $395 and $410, with a revert level at $380.
WWD (Woodward Inc.) is currently classified as choppy range on the daily chart, with 64% confidence. Confirmation requires: 2+ daily closes above $385 would confirm a breakout attempt out of the range This would be invalidated by: Daily close below $360 would invalidate the range-hold thesis and shift bias to a deeper pullback
The most likely scenario (bullish) targets $395 and $410, with a revert level at $380. The alternative scenario (bearish) targets $345 and $328.
Multi-layer AI agents analyse 200+ stocks across daily, weekly, and monthly timeframes — producing market state classifications, price scenarios with targets, and position entry/exit levels. Updated every trading day after market close. No paywall. No sign-up required.
Built by Foliotrail.
All content on this website — including charts, analysis, price targets, support/resistance levels, and position zones — is generated entirely by AI and provided for educational and informational purposes only.
This is not financial advice. NEXUSNOIR VENTURES SL (the operator of this website) is not a registered investment adviser or broker-dealer. You should not make investment decisions based solely on this information. Always do your own research and consult a qualified financial advisor.
By continuing, you acknowledge that you have read and agree to our full disclaimer & terms of use and privacy policy.