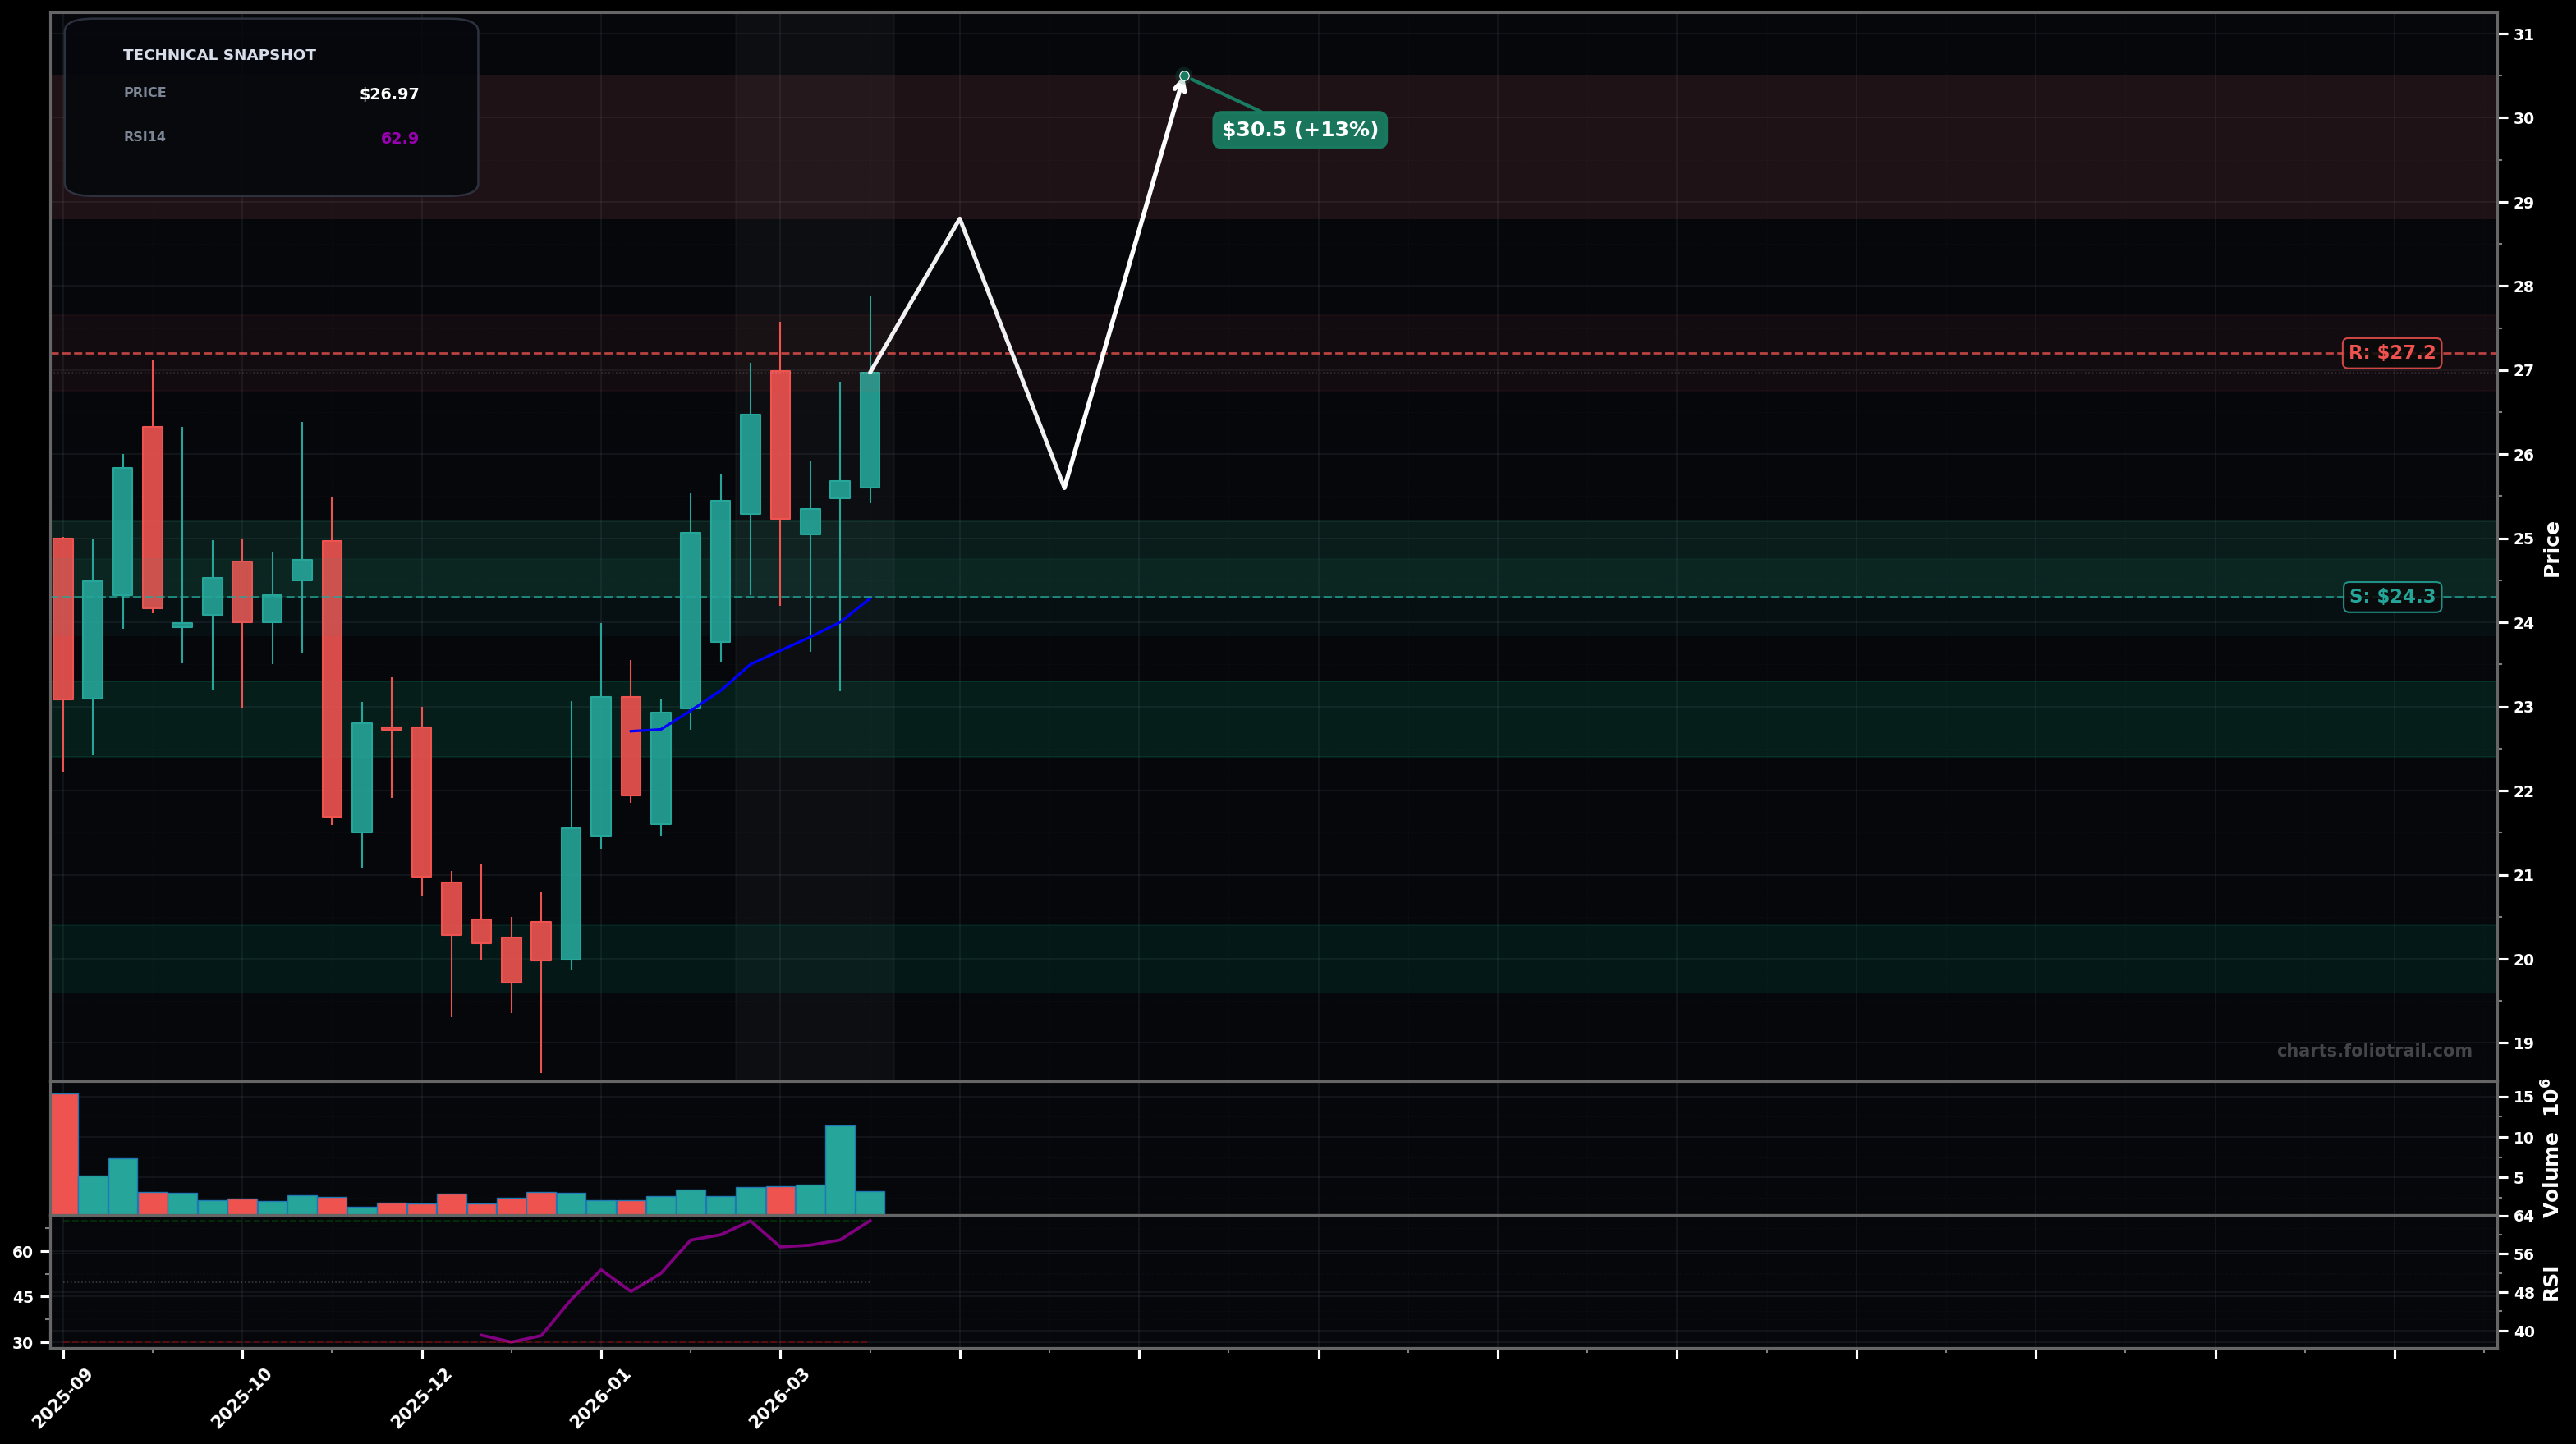
As of March 26, 2026, WBI (WaterBridge Infrastructure LLC) is in a uptrend state on the weekly chart, with a confidence level of 66%. Key support is at $24.3 and key resistance at $27.2. Weekly HH/HL sequence from the ~$19-$20 swing low; price now ~$26.97 pushing into prior supply with RSI ~63 and rising EMA(20) support near ~$24.29.
Bullish continuation: price consolidates briefly above ~$25.60-$26.00 then breaks $27.20 to extend the impulse (Elliott: likely wave 3/5 continuation from the Dec low).
Bearish pullback/ABC: rejection at $27.20 forms a short-term LH and drifts back to the prior breakout zone/MA support before attempting another leg up (Fib-style retrace ~38.2%-50% of the last upswing).
Weekly close above $27.20 with follow-through (next week holds above $27.20).
Weekly close below $24.00 (loss of the rising MA/support shelf).
Start near rising MA/prior breakout support, add on deeper Fib retrace to prior structure, heavy add only on full pullback toward the prior swing-base low area.
Trim into measured-extension zones above the prior high ($27.20) as upside gets stretched; progressively heavier derisk into larger extensions where reversal risk rises.
As of March 26, 2026, WBI (WaterBridge Infrastructure LLC) is in a uptrend state on the weekly chart with 66% confidence. Weekly HH/HL sequence from the ~$19-$20 swing low; price now ~$26.97 pushing into prior supply with RSI ~63 and rising EMA(20) support near ~$24.29.
On the weekly timeframe, WBI has key support at $24.3 and key resistance at $27.2. The most likely scenario (bullish) targets $28.8 and $30.5, with a revert level at $25.6.
WBI (WaterBridge Infrastructure LLC) is currently classified as uptrend on the weekly chart, with 66% confidence. Confirmation requires: Weekly close above $27.20 with follow-through (next week holds above $27.20). This would be invalidated by: Weekly close below $24.00 (loss of the rising MA/support shelf).
The most likely scenario (bullish) targets $28.8 and $30.5, with a revert level at $25.6. The alternative scenario (bearish) targets $24.3 and $22.4.
Multi-layer AI agents analyse 200+ stocks across daily, weekly, and monthly timeframes — producing market state classifications, price scenarios with targets, and position entry/exit levels. Updated every trading day after market close. No paywall. No sign-up required.
Built by Foliotrail.
All content on this website — including charts, analysis, price targets, support/resistance levels, and position zones — is generated entirely by AI and provided for educational and informational purposes only.
This is not financial advice. NEXUSNOIR VENTURES SL (the operator of this website) is not a registered investment adviser or broker-dealer. You should not make investment decisions based solely on this information. Always do your own research and consult a qualified financial advisor.
By continuing, you acknowledge that you have read and agree to our full disclaimer & terms of use and privacy policy.