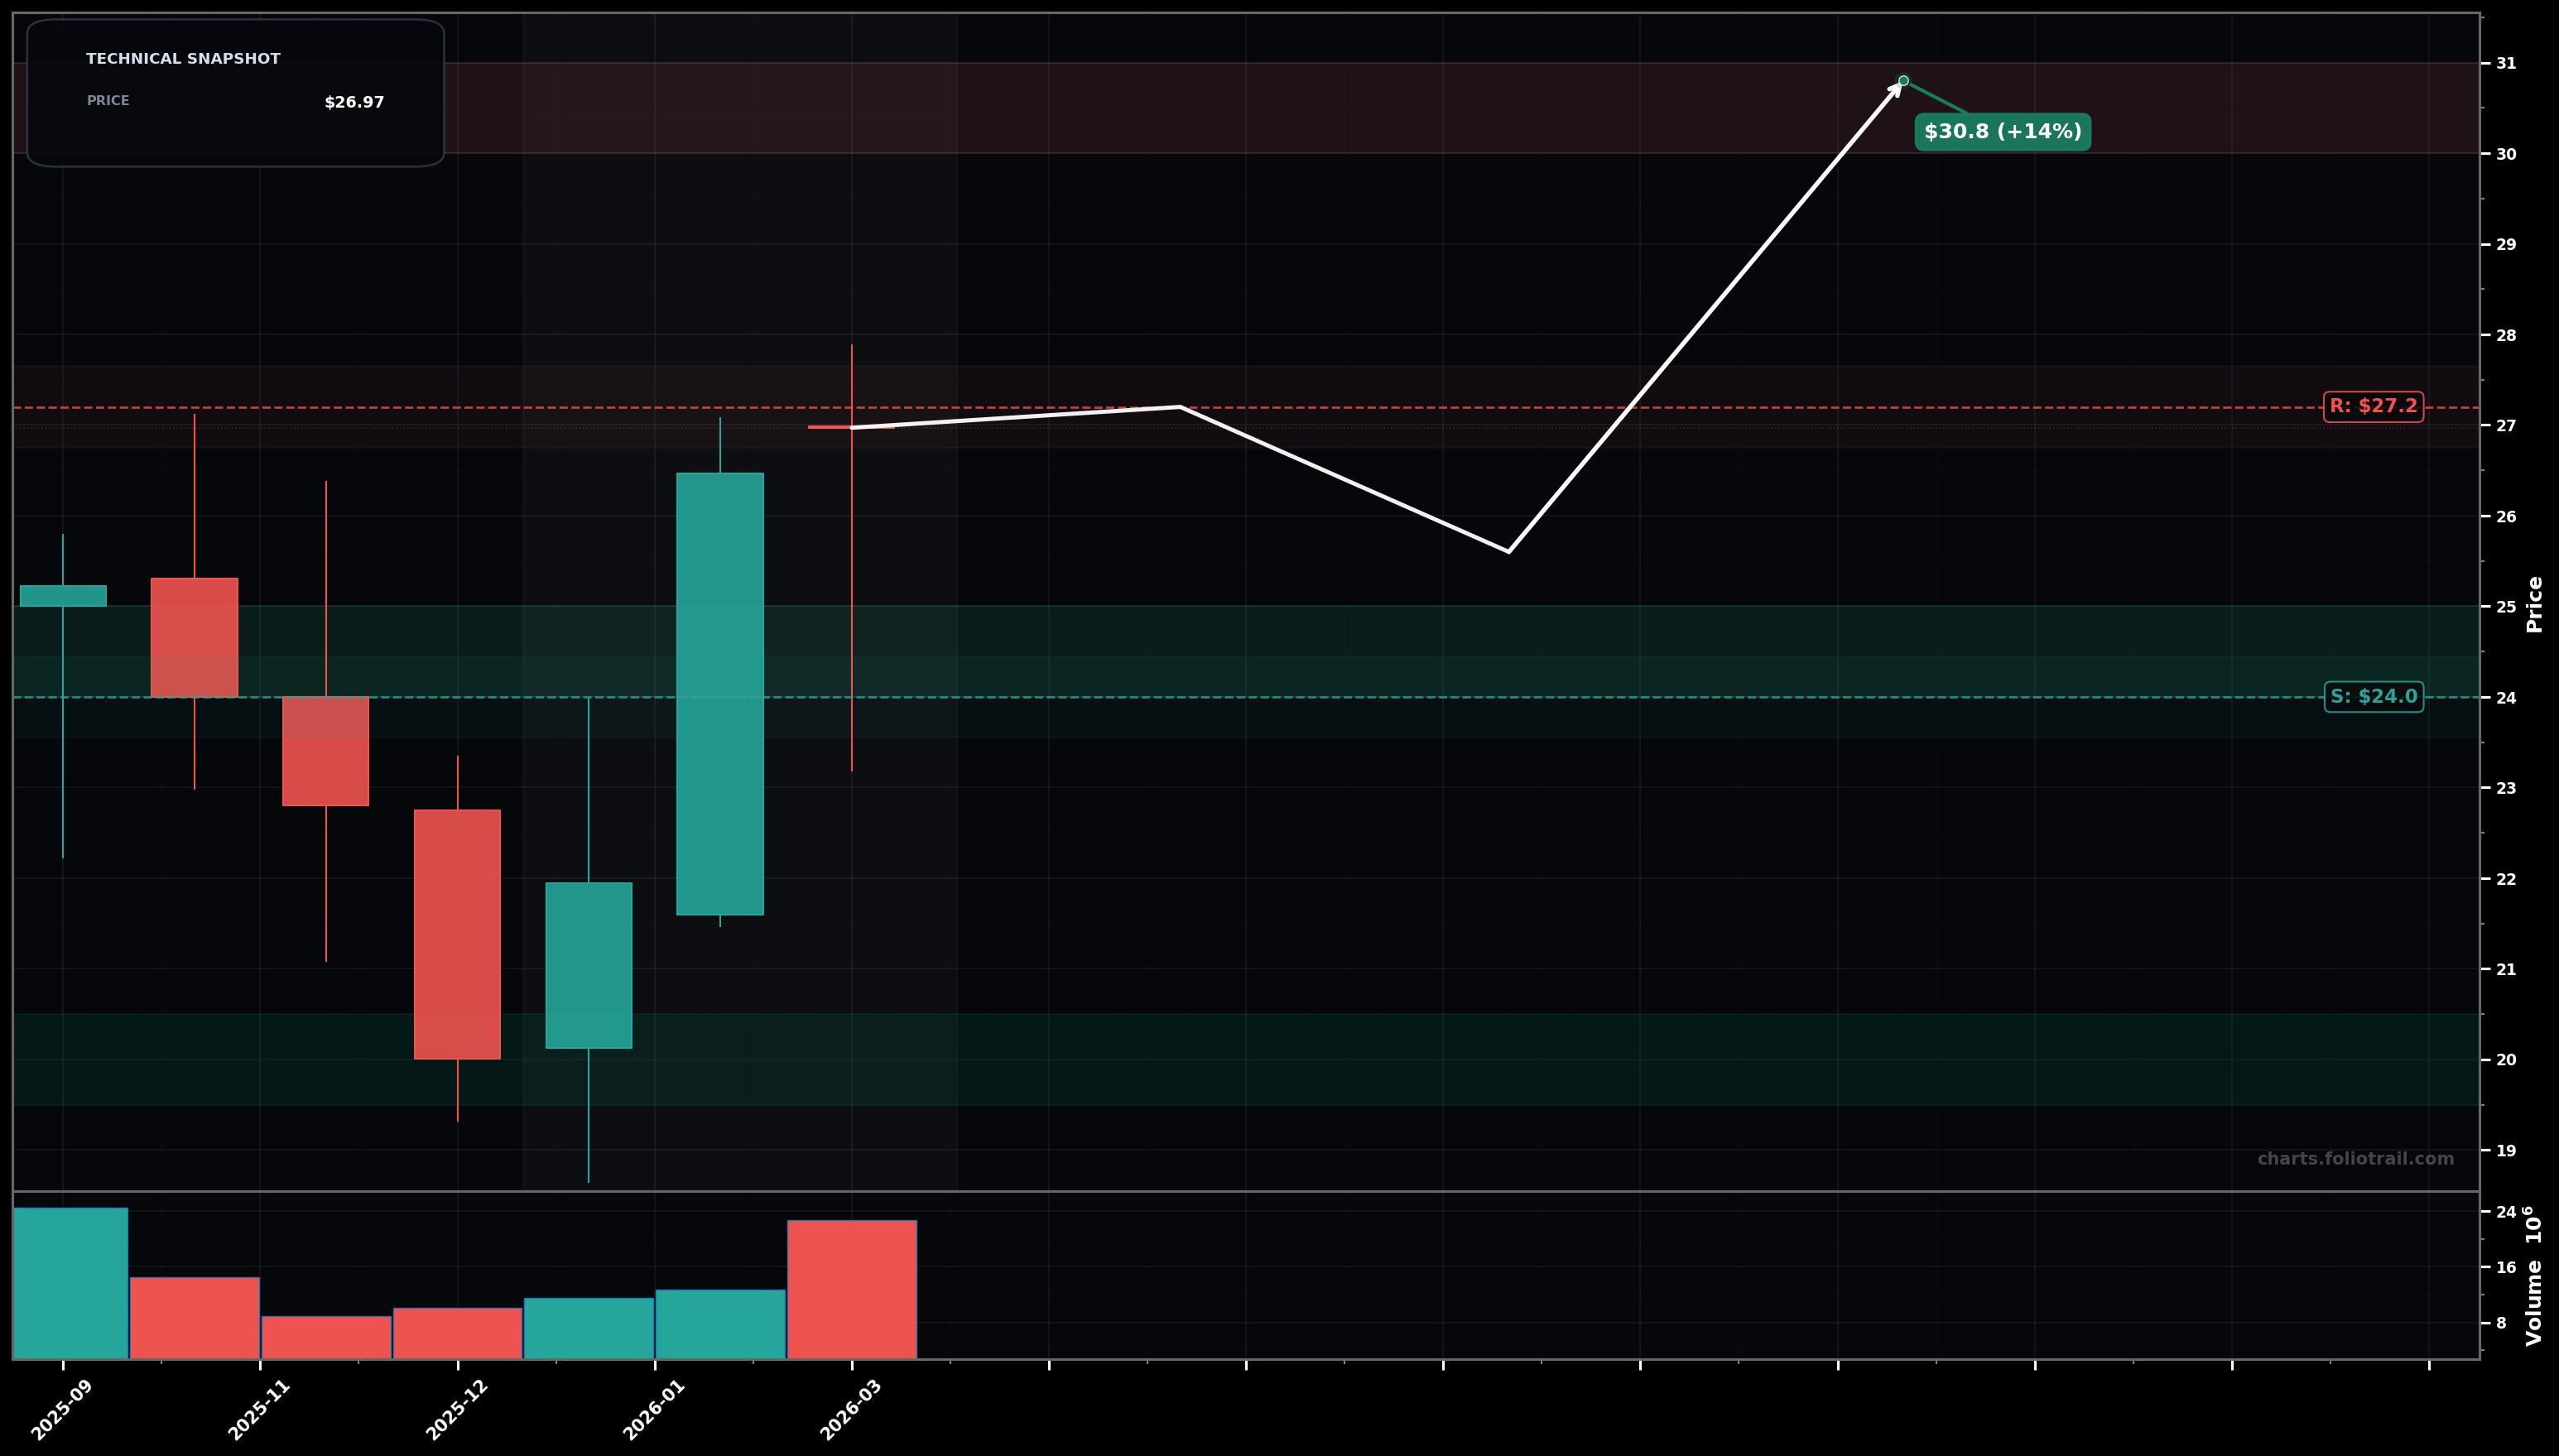
As of March 26, 2026, WBI (WaterBridge Infrastructure LLC) is in a volatility expansion state on the monthly chart, with a confidence level of 63%. Key support is at $24.0 and key resistance at $27.2. Monthly rebound from the $20 area into the $26-$27 zone, followed by a rejection candle with a long upper wick near ~$27.1 and a close around ~$26.97 (profit-taking/failed breakout attempt).
Base-building under $27.20: price chops between ~$24 and ~$27, then breaks higher as the rebound leg resumes (wave-3/5 continuation style).
Rejection at ~$27.20 resolves lower: pullback toward the prior breakout area and the swing-low reference zone (~$20), forming either a deeper wave-2/ABC retrace before any new uptrend attempt.
Two monthly closes above $27.20
Monthly close below $24.00
Start near reclaimed pivot/support ~$24; add on deeper retrace toward mid-range; heavy add at swing-low reference ~$20 where prior selloff halted.
Trim into upside extensions above the recent $27.2 cap (likely fib extensions of the $20→$27 impulse); progressively derisk as price moves into higher-extension zones where mean-reversion risk increases.
As of March 26, 2026, WBI (WaterBridge Infrastructure LLC) is in a volatility expansion state on the monthly chart with 63% confidence. Monthly rebound from the $20 area into the $26-$27 zone, followed by a rejection candle with a long upper wick near ~$27.1 and a close around ~$26.97 (profit-taking/failed breakout attempt).
On the monthly timeframe, WBI has key support at $24.0 and key resistance at $27.2. The most likely scenario (bullish) targets $27.2 and $30.8, with a revert level at $25.6.
WBI (WaterBridge Infrastructure LLC) is currently classified as volatility expansion on the monthly chart, with 63% confidence. Confirmation requires: Two monthly closes above $27.20 This would be invalidated by: Monthly close below $24.00
The most likely scenario (bullish) targets $27.2 and $30.8, with a revert level at $25.6. The alternative scenario (bearish) targets $24.0 and $20.0.
Multi-layer AI agents analyse 200+ stocks across daily, weekly, and monthly timeframes — producing market state classifications, price scenarios with targets, and position entry/exit levels. Updated every trading day after market close. No paywall. No sign-up required.
Built by Foliotrail.
All content on this website — including charts, analysis, price targets, support/resistance levels, and position zones — is generated entirely by AI and provided for educational and informational purposes only.
This is not financial advice. NEXUSNOIR VENTURES SL (the operator of this website) is not a registered investment adviser or broker-dealer. You should not make investment decisions based solely on this information. Always do your own research and consult a qualified financial advisor.
By continuing, you acknowledge that you have read and agree to our full disclaimer & terms of use and privacy policy.