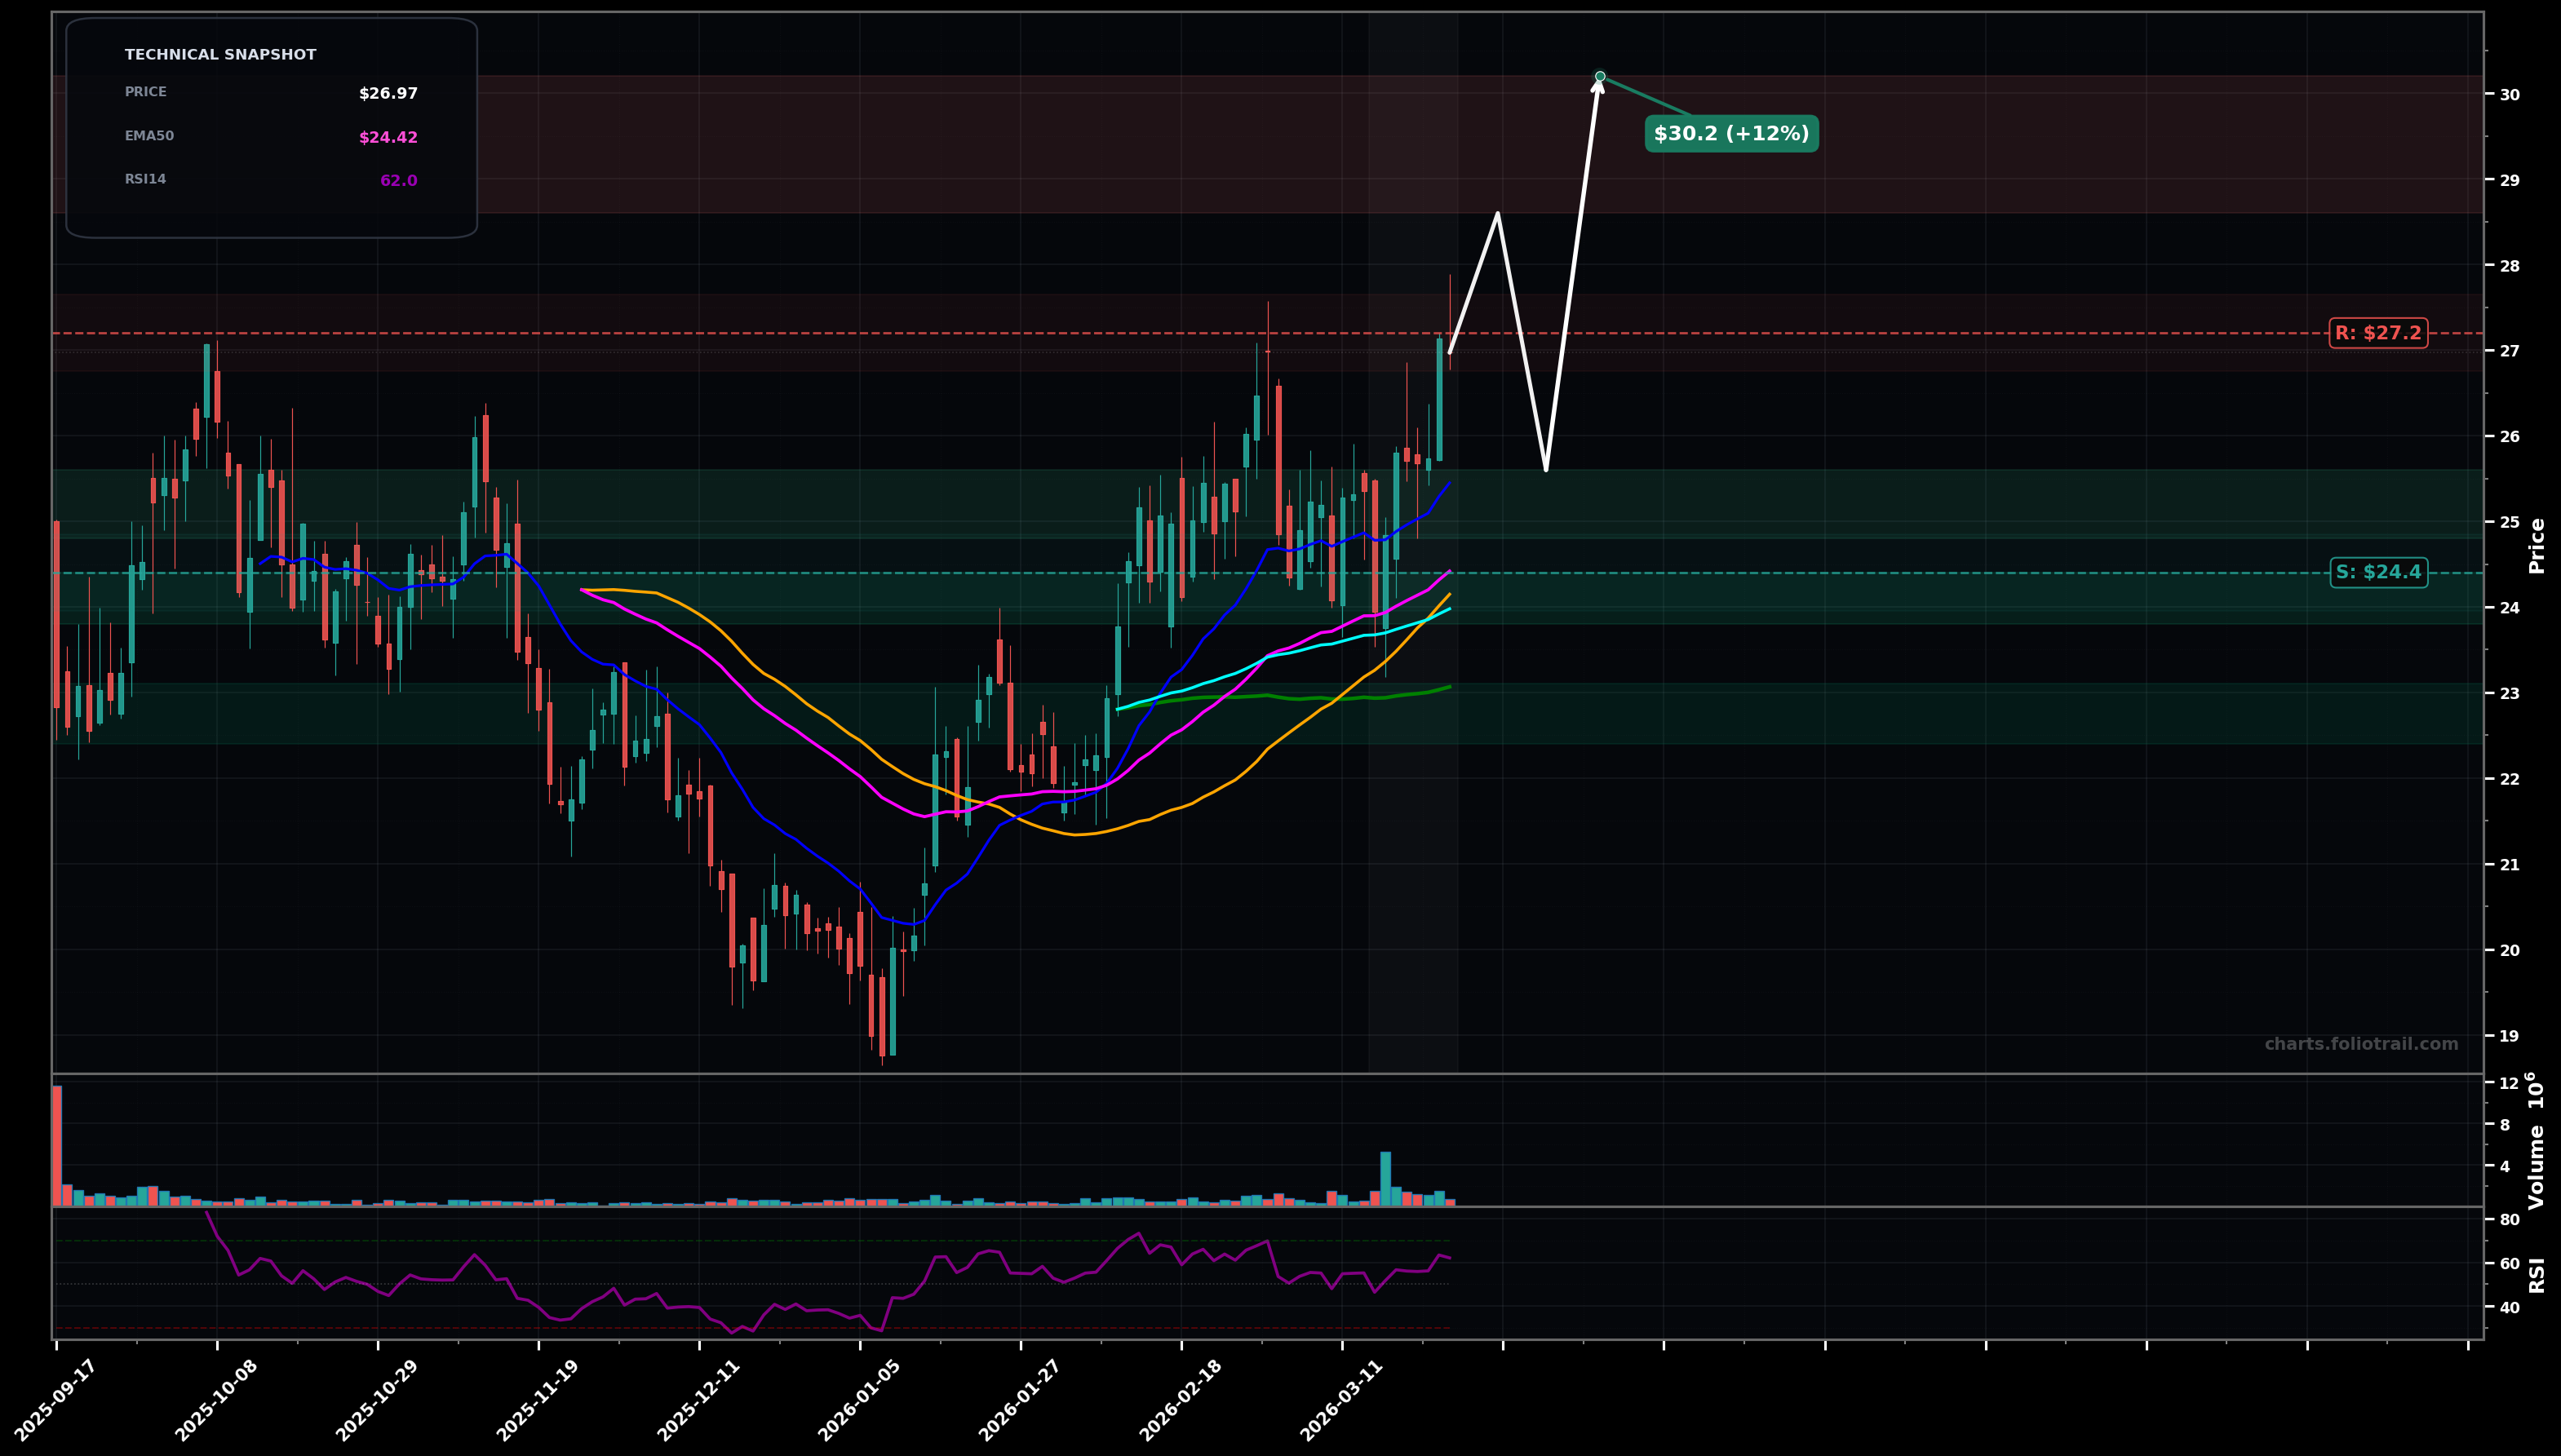
As of March 26, 2026, WBI (WaterBridge Infrastructure LLC) is in a uptrend state on the daily chart, with a confidence level of 74%. Key support is at $24.4 and key resistance at $27.2. Price at ~$26.97 pushed to a fresh local high with momentum (RSI ~62) while holding above EMA50/EMA100; trend structure remains HH/HL after the early-Jan swing low.
Bull continuation: brief consolidation/pullback holds above the $24.4–$25.0 demand zone, then breaks $27.2 and extends higher (likely Elliott Wave: late Wave 3 or Wave 5 advance; prior pullback looks like a Wave 4-type consolidation).
Bearish pullback: rejection near $27.2 triggers a deeper retrace toward the confluence of EMA100/cost-basis MAs; would be a larger Wave 4 / ABC correction before the next attempt higher (Fib focus: 38.2%–61.8% retrace of the Jan–Mar impulse).
2+ daily closes above $27.20 (recent high/overhead supply) would confirm continuation
Daily close below $24.40 (EMA50 + prior breakout area) would invalidate the clean uptrend structure
Start on pullback to prior breakout/demand; add at EMA100/cyan + structure support; heavy add near SMA100/green (~$23.1) and deeper Fib retrace where trend should defend if intact.
Trim into measured extension above the $27.2 breakout (momentum likely stretched vs EMA50); heavier trims on further Fibonacci extensions; close if price becomes multi-year stretched relative to the MA stack and prior range highs.
As of March 26, 2026, WBI (WaterBridge Infrastructure LLC) is in a uptrend state on the daily chart with 74% confidence. Price at ~$26.97 pushed to a fresh local high with momentum (RSI ~62) while holding above EMA50/EMA100; trend structure remains HH/HL after the early-Jan swing low.
On the daily timeframe, WBI has key support at $24.4 and key resistance at $27.2. The most likely scenario (bullish) targets $28.6 and $30.2, with a revert level at $25.6.
WBI (WaterBridge Infrastructure LLC) is currently classified as uptrend on the daily chart, with 74% confidence. Confirmation requires: 2+ daily closes above $27.20 (recent high/overhead supply) would confirm continuation This would be invalidated by: Daily close below $24.40 (EMA50 + prior breakout area) would invalidate the clean uptrend structure
The most likely scenario (bullish) targets $28.6 and $30.2, with a revert level at $25.6. The alternative scenario (bearish) targets $23.9 and $22.8.
Multi-layer AI agents analyse 200+ stocks across daily, weekly, and monthly timeframes — producing market state classifications, price scenarios with targets, and position entry/exit levels. Updated every trading day after market close. No paywall. No sign-up required.
Built by Foliotrail.
All content on this website — including charts, analysis, price targets, support/resistance levels, and position zones — is generated entirely by AI and provided for educational and informational purposes only.
This is not financial advice. NEXUSNOIR VENTURES SL (the operator of this website) is not a registered investment adviser or broker-dealer. You should not make investment decisions based solely on this information. Always do your own research and consult a qualified financial advisor.
By continuing, you acknowledge that you have read and agree to our full disclaimer & terms of use and privacy policy.