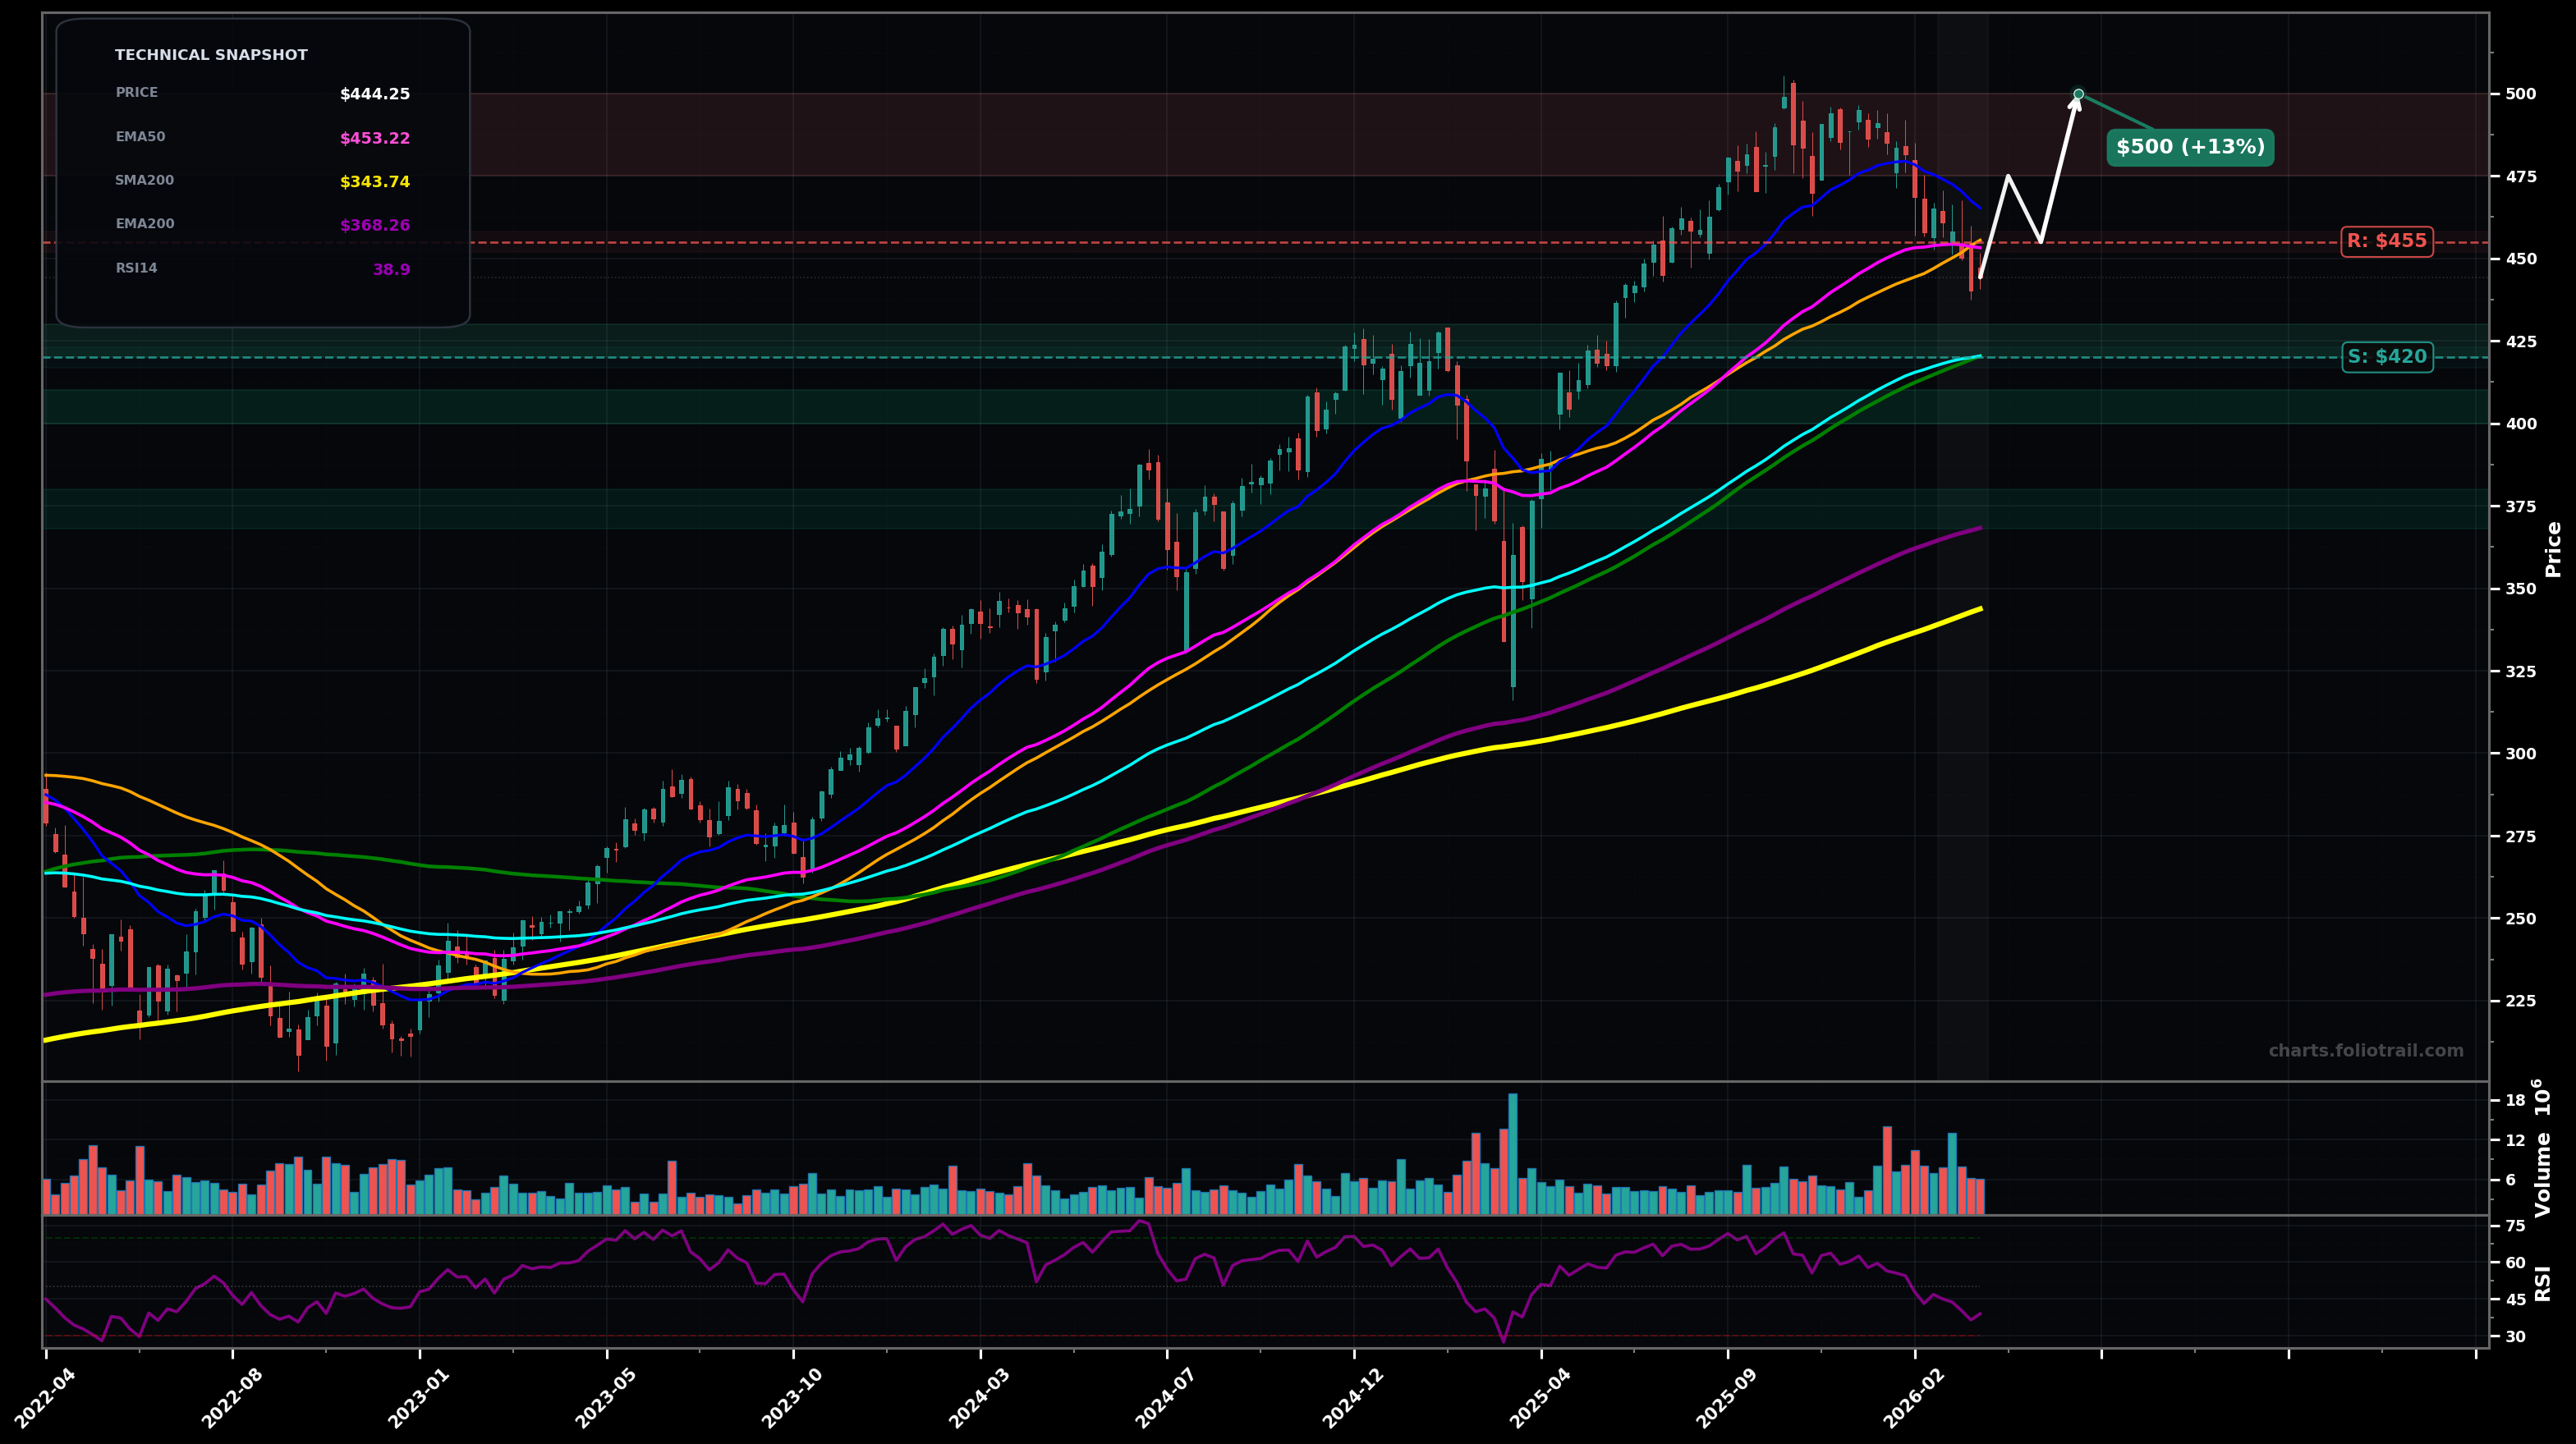
As of March 26, 2026, VUG (Vanguard Growth ETF) is in a bottoming attempt state on the weekly chart, with a confidence level of 58%. Key support is at $420 and key resistance at $455. Weekly pullback from the ~$500 area with price at $444.25 now below the falling SMA50 ($455.52) and below EMA50 ($453.22) while still holding above EMA100/SMA100 (~$420). RSI14 is weak at ~38.9.
Base-building between $420–$455, then a reclaim of the $455 area and push toward the prior breakdown zone near $475; if momentum follows through, a retest of ~$500 becomes possible (corrective Wave 4 likely finishing, then a Wave 5 attempt).
Support fails: weekly close under $420 triggers continuation of the correction toward the next higher-timeframe supports around $400 and then ~$368 (EMA200 purple), consistent with a deeper Wave 4 / larger ABC retrace; key fib zone to watch is the ~$400 area (common 38.2–50% retrace region of the 2023–2025 advance).
Two weekly closes back above $455 (reclaim of SMA50/EMA50 zone) would confirm a breakout-reversal from this pullback
Weekly close below $420 would invalidate the bottoming attempt and shift risk toward a deeper trend breakdown
Start near EMA100/SMA100 support ($420 area); add on a deeper fib-style retrace into ~$400; heavy add near EMA200 (purple) where trend investors often defend.
Trim into resistance from prior highs (~$475–$500) and potential Wave-5 exhaustion above ATH; stronger trimming/exit if price becomes extended well above rising long MAs (risk of mean reversion increases).
As of March 26, 2026, VUG (Vanguard Growth ETF) is in a bottoming attempt state on the weekly chart with 58% confidence. Weekly pullback from the ~$500 area with price at $444.25 now below the falling SMA50 ($455.52) and below EMA50 ($453.22) while still holding above EMA100/SMA100 (~$420). RSI14 is weak at ~38.9.
On the weekly timeframe, VUG has key support at $420 and key resistance at $455. The most likely scenario (bullish) targets $475 and $500, with a revert level at $455.
VUG (Vanguard Growth ETF) is currently classified as bottoming attempt on the weekly chart, with 58% confidence. Confirmation requires: Two weekly closes back above $455 (reclaim of SMA50/EMA50 zone) would confirm a breakout-reversal from this pullback This would be invalidated by: Weekly close below $420 would invalidate the bottoming attempt and shift risk toward a deeper trend breakdown
The most likely scenario (bullish) targets $475 and $500, with a revert level at $455. The alternative scenario (bearish) targets $400 and $368.
Multi-layer AI agents analyse 200+ stocks across daily, weekly, and monthly timeframes — producing market state classifications, price scenarios with targets, and position entry/exit levels. Updated every trading day after market close. No paywall. No sign-up required.
Built by Foliotrail.
All content on this website — including charts, analysis, price targets, support/resistance levels, and position zones — is generated entirely by AI and provided for educational and informational purposes only.
This is not financial advice. NEXUSNOIR VENTURES SL (the operator of this website) is not a registered investment adviser or broker-dealer. You should not make investment decisions based solely on this information. Always do your own research and consult a qualified financial advisor.
By continuing, you acknowledge that you have read and agree to our full disclaimer & terms of use and privacy policy.