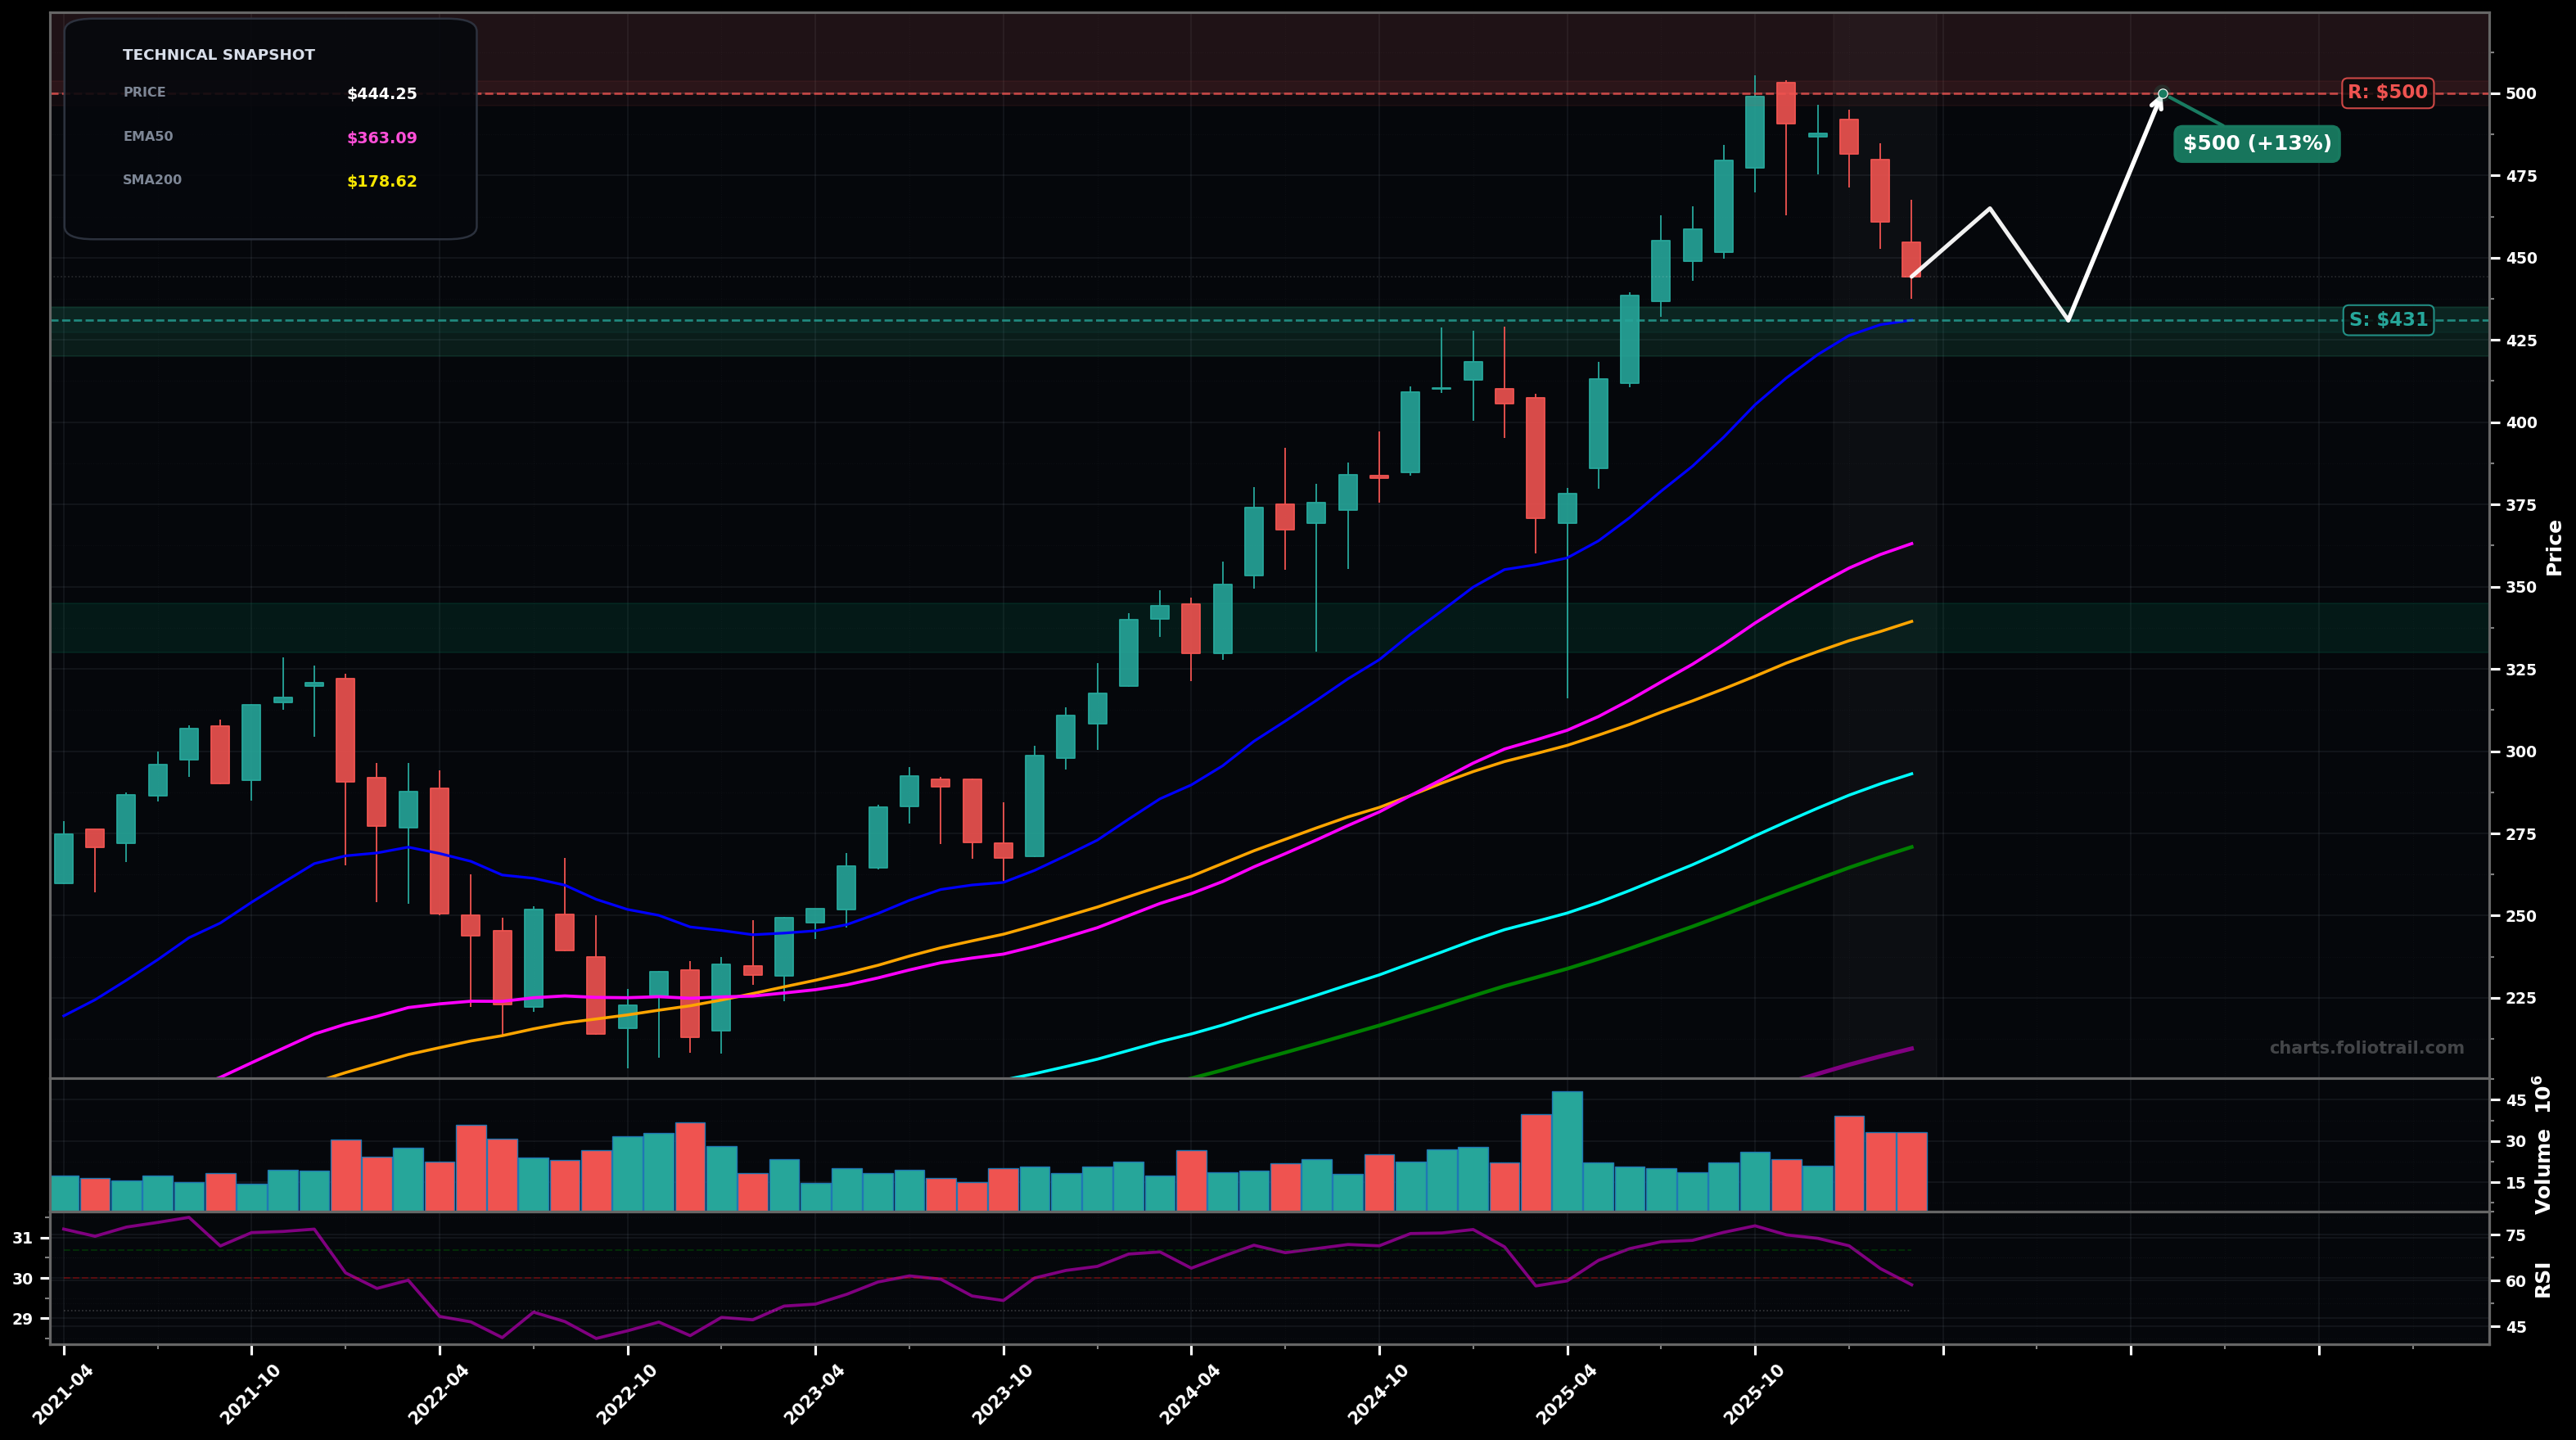
As of March 26, 2026, VUG (Vanguard Growth ETF) is in a volatility expansion state on the monthly chart, with a confidence level of 62%. Key support is at $431 and key resistance at $500. Monthly pullback from ~$500 peak; consecutive red candles with volume uptick, but price still well above rising EMA50/EMA100 and prior breakout zone.
Base-building pullback: price mean-reverts into the EMA20/previous breakout area (~$431) then stabilizes and attempts a higher low before resuming the primary uptrend toward the prior high.
Deeper correction: rejection below ~$465 leads to a continuation selloff into the EMA50 confluence; trend remains intact only if it holds and bounces, otherwise risks a larger ABC down.
State holds if monthly closes keep holding above ~$431 (EMA20) while volatility stays elevated.
Invalid if a monthly close breaks and holds below ~$363 (EMA50).
Start near EMA20/support (~$431); add at EMA50 (~$363) if pullback deepens; heavy add at SMA50 (~$339) which is typical 0.382–0.5 retrace zone of the last impulse and key trend support.
Trim into prior-high/extension zone (~$500+) and further into likely fib extensions above the prior peak (1.272–1.618); fully close only if price becomes multi-year stretched far above EMA50/EMA100 with parabolic behavior.
As of March 26, 2026, VUG (Vanguard Growth ETF) is in a volatility expansion state on the monthly chart with 62% confidence. Monthly pullback from ~$500 peak; consecutive red candles with volume uptick, but price still well above rising EMA50/EMA100 and prior breakout zone.
On the monthly timeframe, VUG has key support at $431 and key resistance at $500. The most likely scenario (bullish) targets $465 and $500, with a revert level at $431.
VUG (Vanguard Growth ETF) is currently classified as volatility expansion on the monthly chart, with 62% confidence. Confirmation requires: State holds if monthly closes keep holding above ~$431 (EMA20) while volatility stays elevated. This would be invalidated by: Invalid if a monthly close breaks and holds below ~$363 (EMA50).
The most likely scenario (bullish) targets $465 and $500, with a revert level at $431. The alternative scenario (bearish) targets $363 and $339.
Multi-layer AI agents analyse 200+ stocks across daily, weekly, and monthly timeframes — producing market state classifications, price scenarios with targets, and position entry/exit levels. Updated every trading day after market close. No paywall. No sign-up required.
Built by Foliotrail.
All content on this website — including charts, analysis, price targets, support/resistance levels, and position zones — is generated entirely by AI and provided for educational and informational purposes only.
This is not financial advice. NEXUSNOIR VENTURES SL (the operator of this website) is not a registered investment adviser or broker-dealer. You should not make investment decisions based solely on this information. Always do your own research and consult a qualified financial advisor.
By continuing, you acknowledge that you have read and agree to our full disclaimer & terms of use and privacy policy.