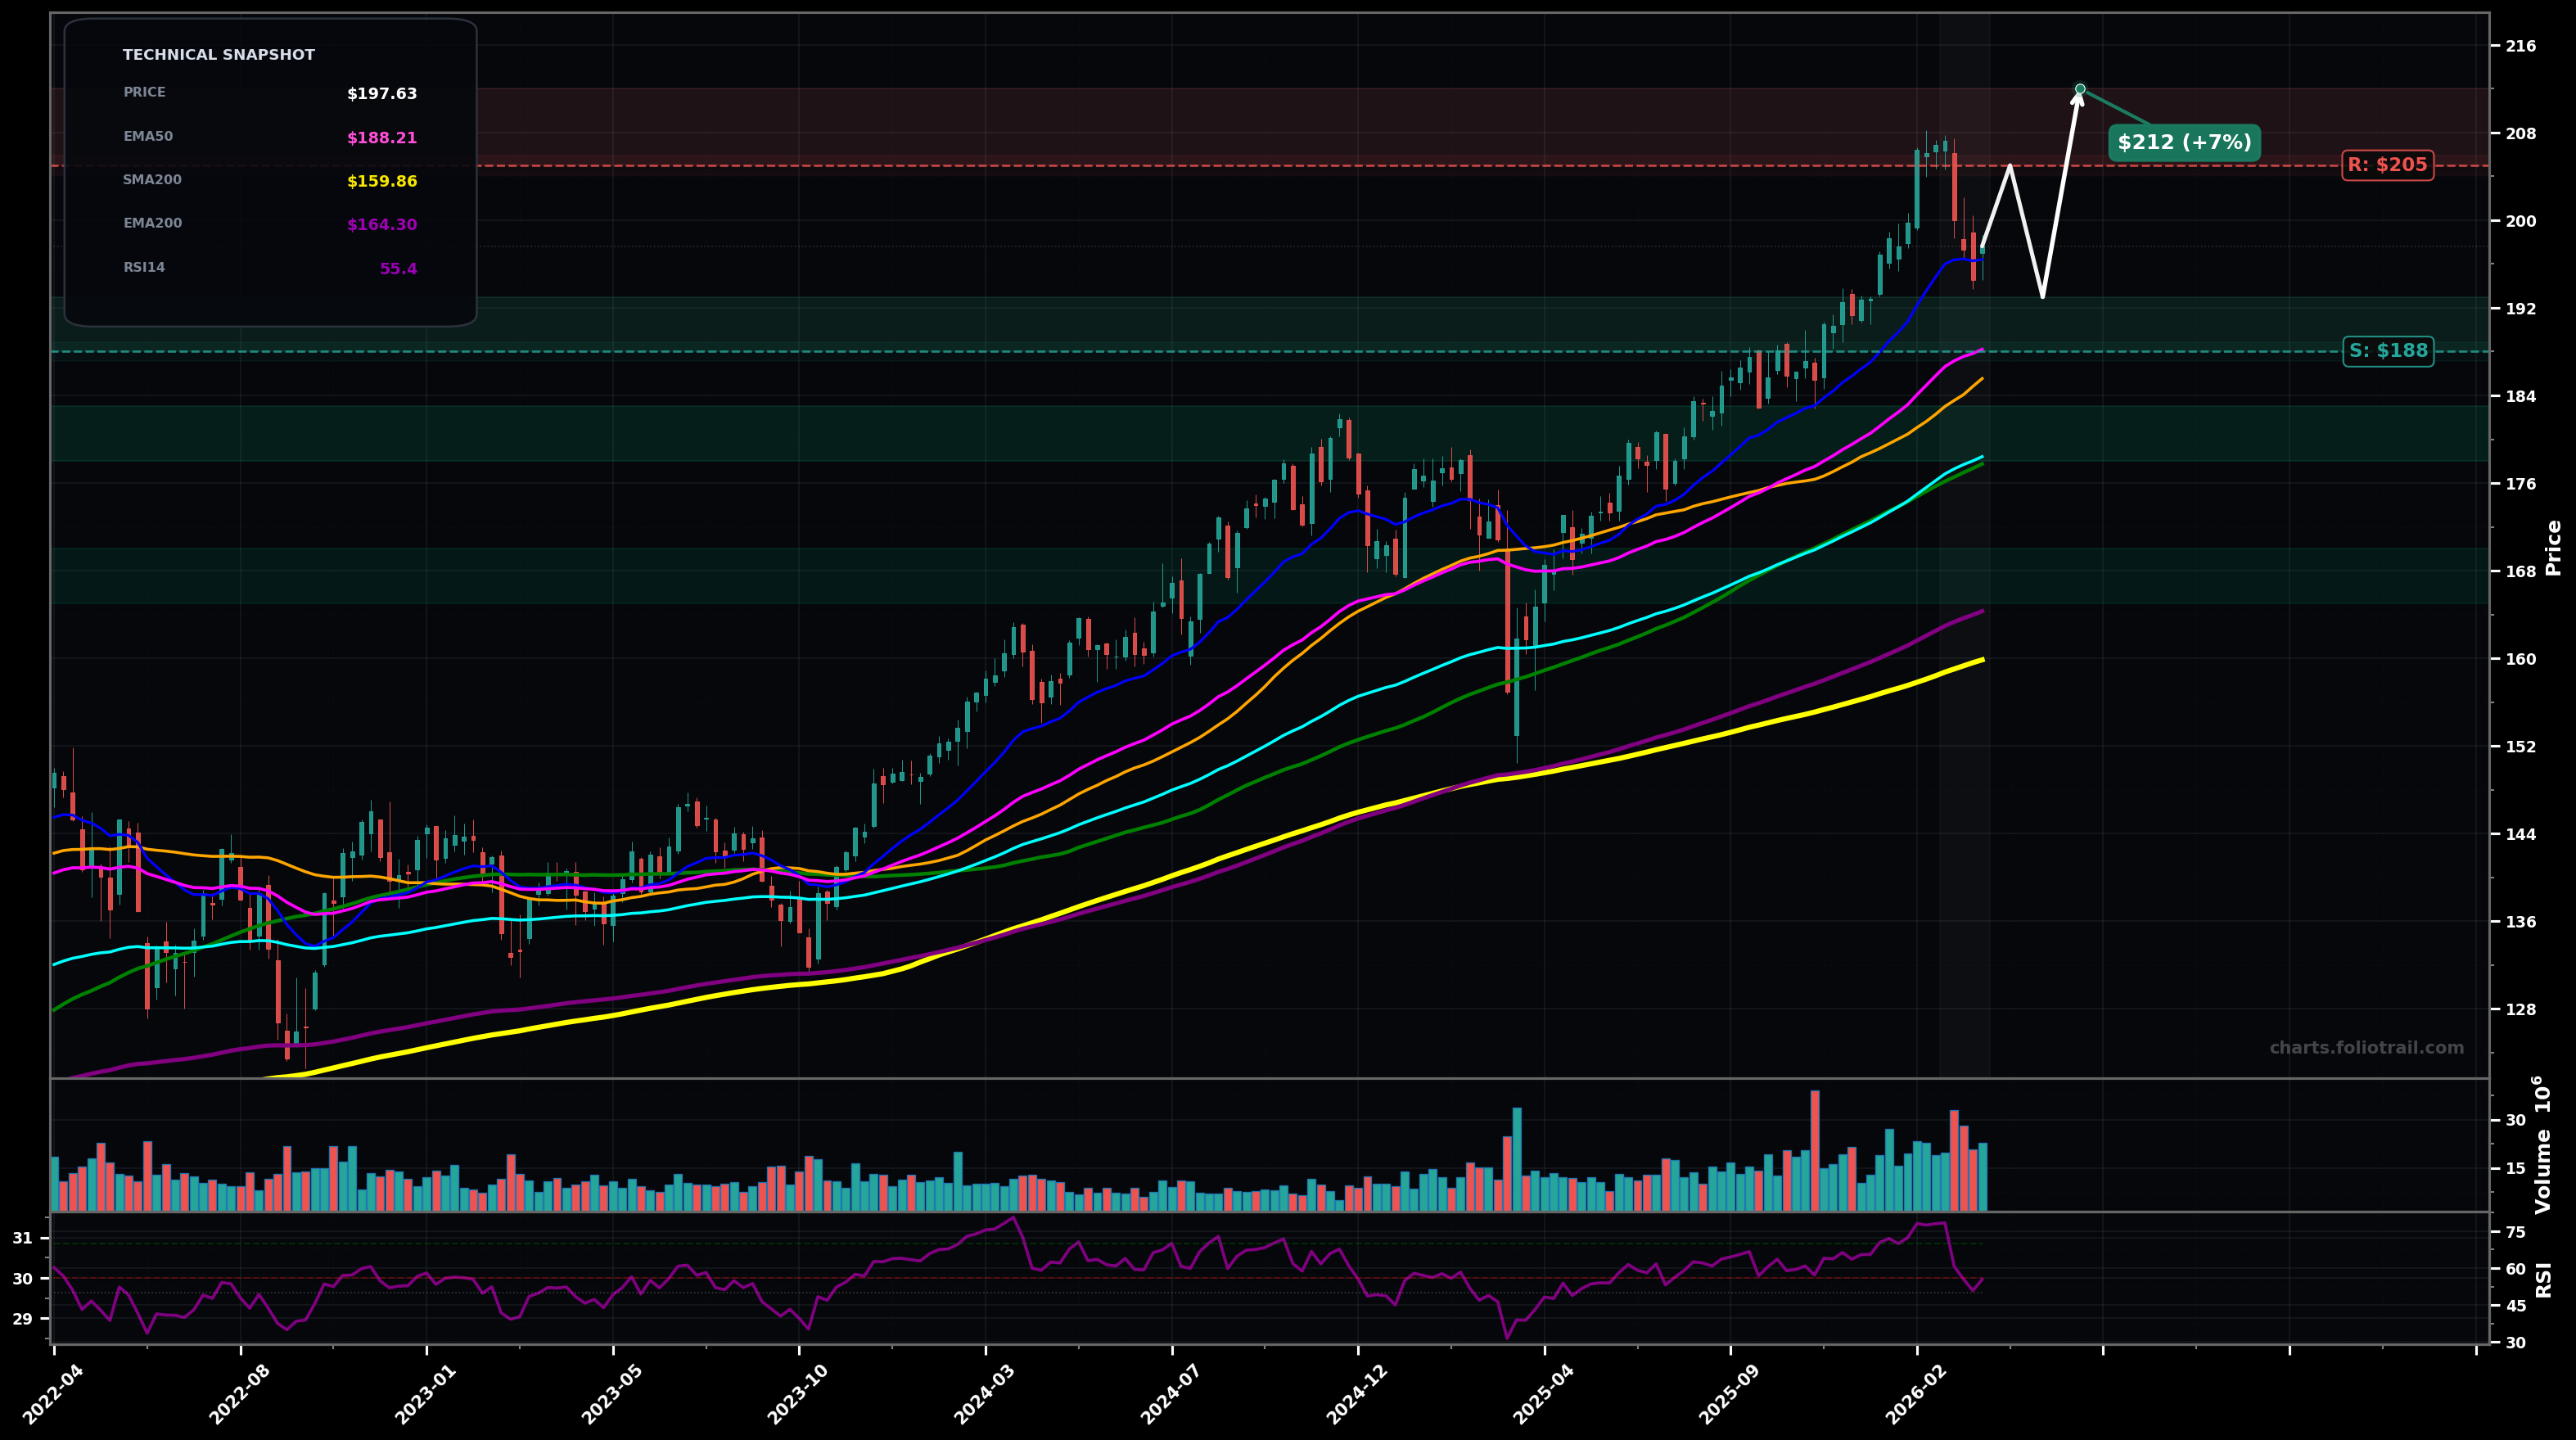
As of March 26, 2026, VTV (Vanguard Value ETF) is in a uptrend state on the weekly chart, with a confidence level of 73%. Key support is at $188 and key resistance at $205. Weekly uptrend pulled back from the ~$205 area; current price ~$197.63 remains above rising EMA50 (~$188.21) and EMA100 (~$178.41) with RSI ~55 (cooling, not oversold).
Bullish continuation: pullback holds above EMA50, then price reclaims $200 and makes a new swing high (wave 5 extension / trend continuation).
Deeper corrective ABC: failure to reclaim $200 leads to a breakdown below EMA50 and a mean-reversion test of EMA100 / prior consolidation zone; trend remains intact if it forms a higher low there.
2+ weekly closes back above $200 would confirm trend resumption toward the highs.
Weekly close below $188 would invalidate the immediate uptrend structure (loss of EMA50/near-term swing support).
Scale-in at EMA50 support first; add on EMA100 retest; heavy add near EMA200 (~$164) / deeper Fib-retracement area where weekly trend should attract buyers if still bullish.
Trim into prior high/upper channel (likely wave-5 exhaustion); increase trims on extended breakout; close if price becomes heavily stretched above rising MAs (risk of multi-month mean reversion).
As of March 26, 2026, VTV (Vanguard Value ETF) is in a uptrend state on the weekly chart with 73% confidence. Weekly uptrend pulled back from the ~$205 area; current price ~$197.63 remains above rising EMA50 (~$188.21) and EMA100 (~$178.41) with RSI ~55 (cooling, not oversold).
On the weekly timeframe, VTV has key support at $188 and key resistance at $205. The most likely scenario (bullish) targets $205 and $212, with a revert level at $193.
VTV (Vanguard Value ETF) is currently classified as uptrend on the weekly chart, with 73% confidence. Confirmation requires: 2+ weekly closes back above $200 would confirm trend resumption toward the highs. This would be invalidated by: Weekly close below $188 would invalidate the immediate uptrend structure (loss of EMA50/near-term swing support).
The most likely scenario (bullish) targets $205 and $212, with a revert level at $193. The alternative scenario (bearish) targets $178 and $165.
Multi-layer AI agents analyse 200+ stocks across daily, weekly, and monthly timeframes — producing market state classifications, price scenarios with targets, and position entry/exit levels. Updated every trading day after market close. No paywall. No sign-up required.
Built by Foliotrail.
All content on this website — including charts, analysis, price targets, support/resistance levels, and position zones — is generated entirely by AI and provided for educational and informational purposes only.
This is not financial advice. NEXUSNOIR VENTURES SL (the operator of this website) is not a registered investment adviser or broker-dealer. You should not make investment decisions based solely on this information. Always do your own research and consult a qualified financial advisor.
By continuing, you acknowledge that you have read and agree to our full disclaimer & terms of use and privacy policy.