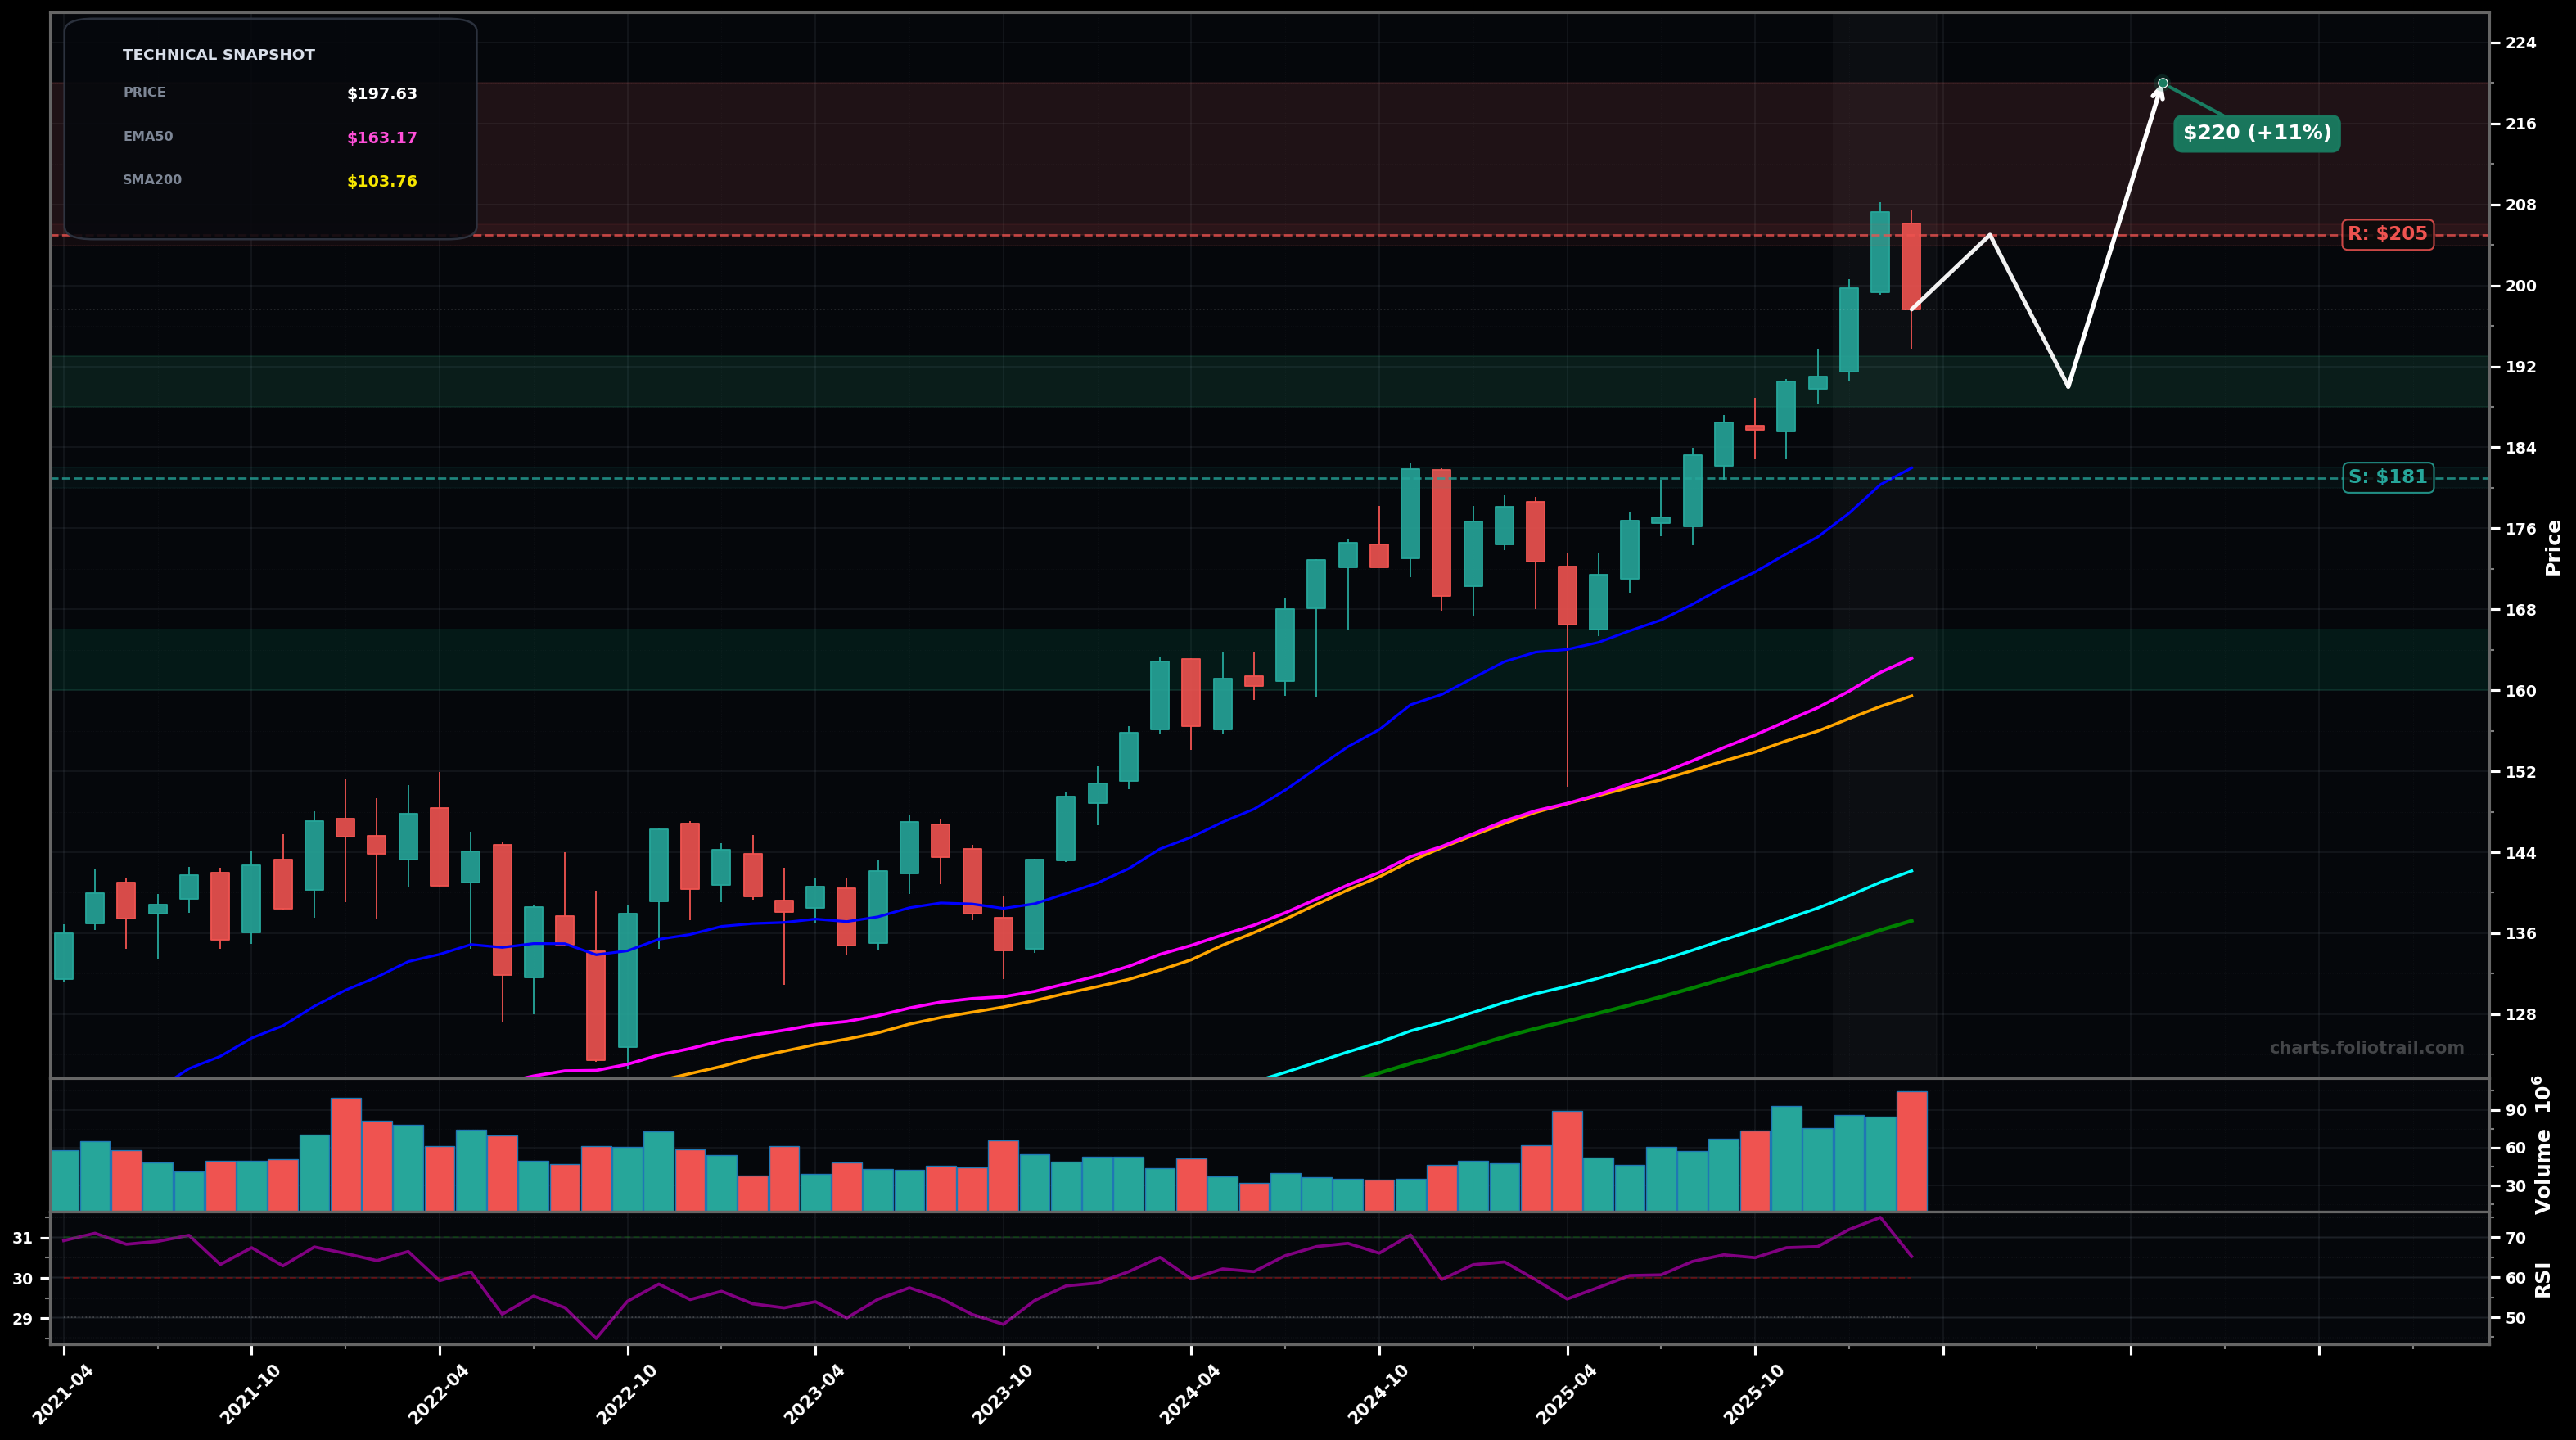
As of March 26, 2026, VTV (Vanguard Value ETF) is in a uptrend state on the monthly chart, with a confidence level of 78%. Key support is at $181 and key resistance at $205. Monthly uptrend; strong run to ~$205 then a pullback to ~$197 with RSI(14) ~65 (cooling but not weak).
Base-and-continue: pullback holds above ~$181 (prior swing area/EMA20) then resumes uptrend toward a new high; Elliott view: late Wave 5 continuation with a brief Wave 4-type consolidation.
Deeper monthly correction: failure to reclaim ~$205 leads to a multi-month pullback to the rising EMA50/SMA50 cluster; Elliott view: Wave 5 ended and an A-B-C correction unfolds toward key Fib retracements of the 2023-2026 advance.
Monthly close back above ~$205 keeps the HH sequence intact and signals continuation.
Monthly close below ~$181 (EMA20 area / prior breakout zone) would suggest a deeper trend correction.
Start on shallow pullback near ~$190; add on a clean hold/reclaim of the ~$181 support/EMA20 zone; heavy add only if mean reversion reaches the rising EMA50 (~$163) where trend support is strongest.
Trim into strength at/above the prior high (~$205) and projected extension zone (~$220); intensify trims if price becomes extended far above EMA50/EMA100; fully close only in a clear blow-off/overextension regime ($240+).
As of March 26, 2026, VTV (Vanguard Value ETF) is in a uptrend state on the monthly chart with 78% confidence. Monthly uptrend; strong run to ~$205 then a pullback to ~$197 with RSI(14) ~65 (cooling but not weak).
On the monthly timeframe, VTV has key support at $181 and key resistance at $205. The most likely scenario (bullish) targets $205 and $220, with a revert level at $190.
VTV (Vanguard Value ETF) is currently classified as uptrend on the monthly chart, with 78% confidence. Confirmation requires: Monthly close back above ~$205 keeps the HH sequence intact and signals continuation. This would be invalidated by: Monthly close below ~$181 (EMA20 area / prior breakout zone) would suggest a deeper trend correction.
The most likely scenario (bullish) targets $205 and $220, with a revert level at $190. The alternative scenario (bearish) targets $181 and $163.
Multi-layer AI agents analyse 200+ stocks across daily, weekly, and monthly timeframes — producing market state classifications, price scenarios with targets, and position entry/exit levels. Updated every trading day after market close. No paywall. No sign-up required.
Built by Foliotrail.
All content on this website — including charts, analysis, price targets, support/resistance levels, and position zones — is generated entirely by AI and provided for educational and informational purposes only.
This is not financial advice. NEXUSNOIR VENTURES SL (the operator of this website) is not a registered investment adviser or broker-dealer. You should not make investment decisions based solely on this information. Always do your own research and consult a qualified financial advisor.
By continuing, you acknowledge that you have read and agree to our full disclaimer & terms of use and privacy policy.