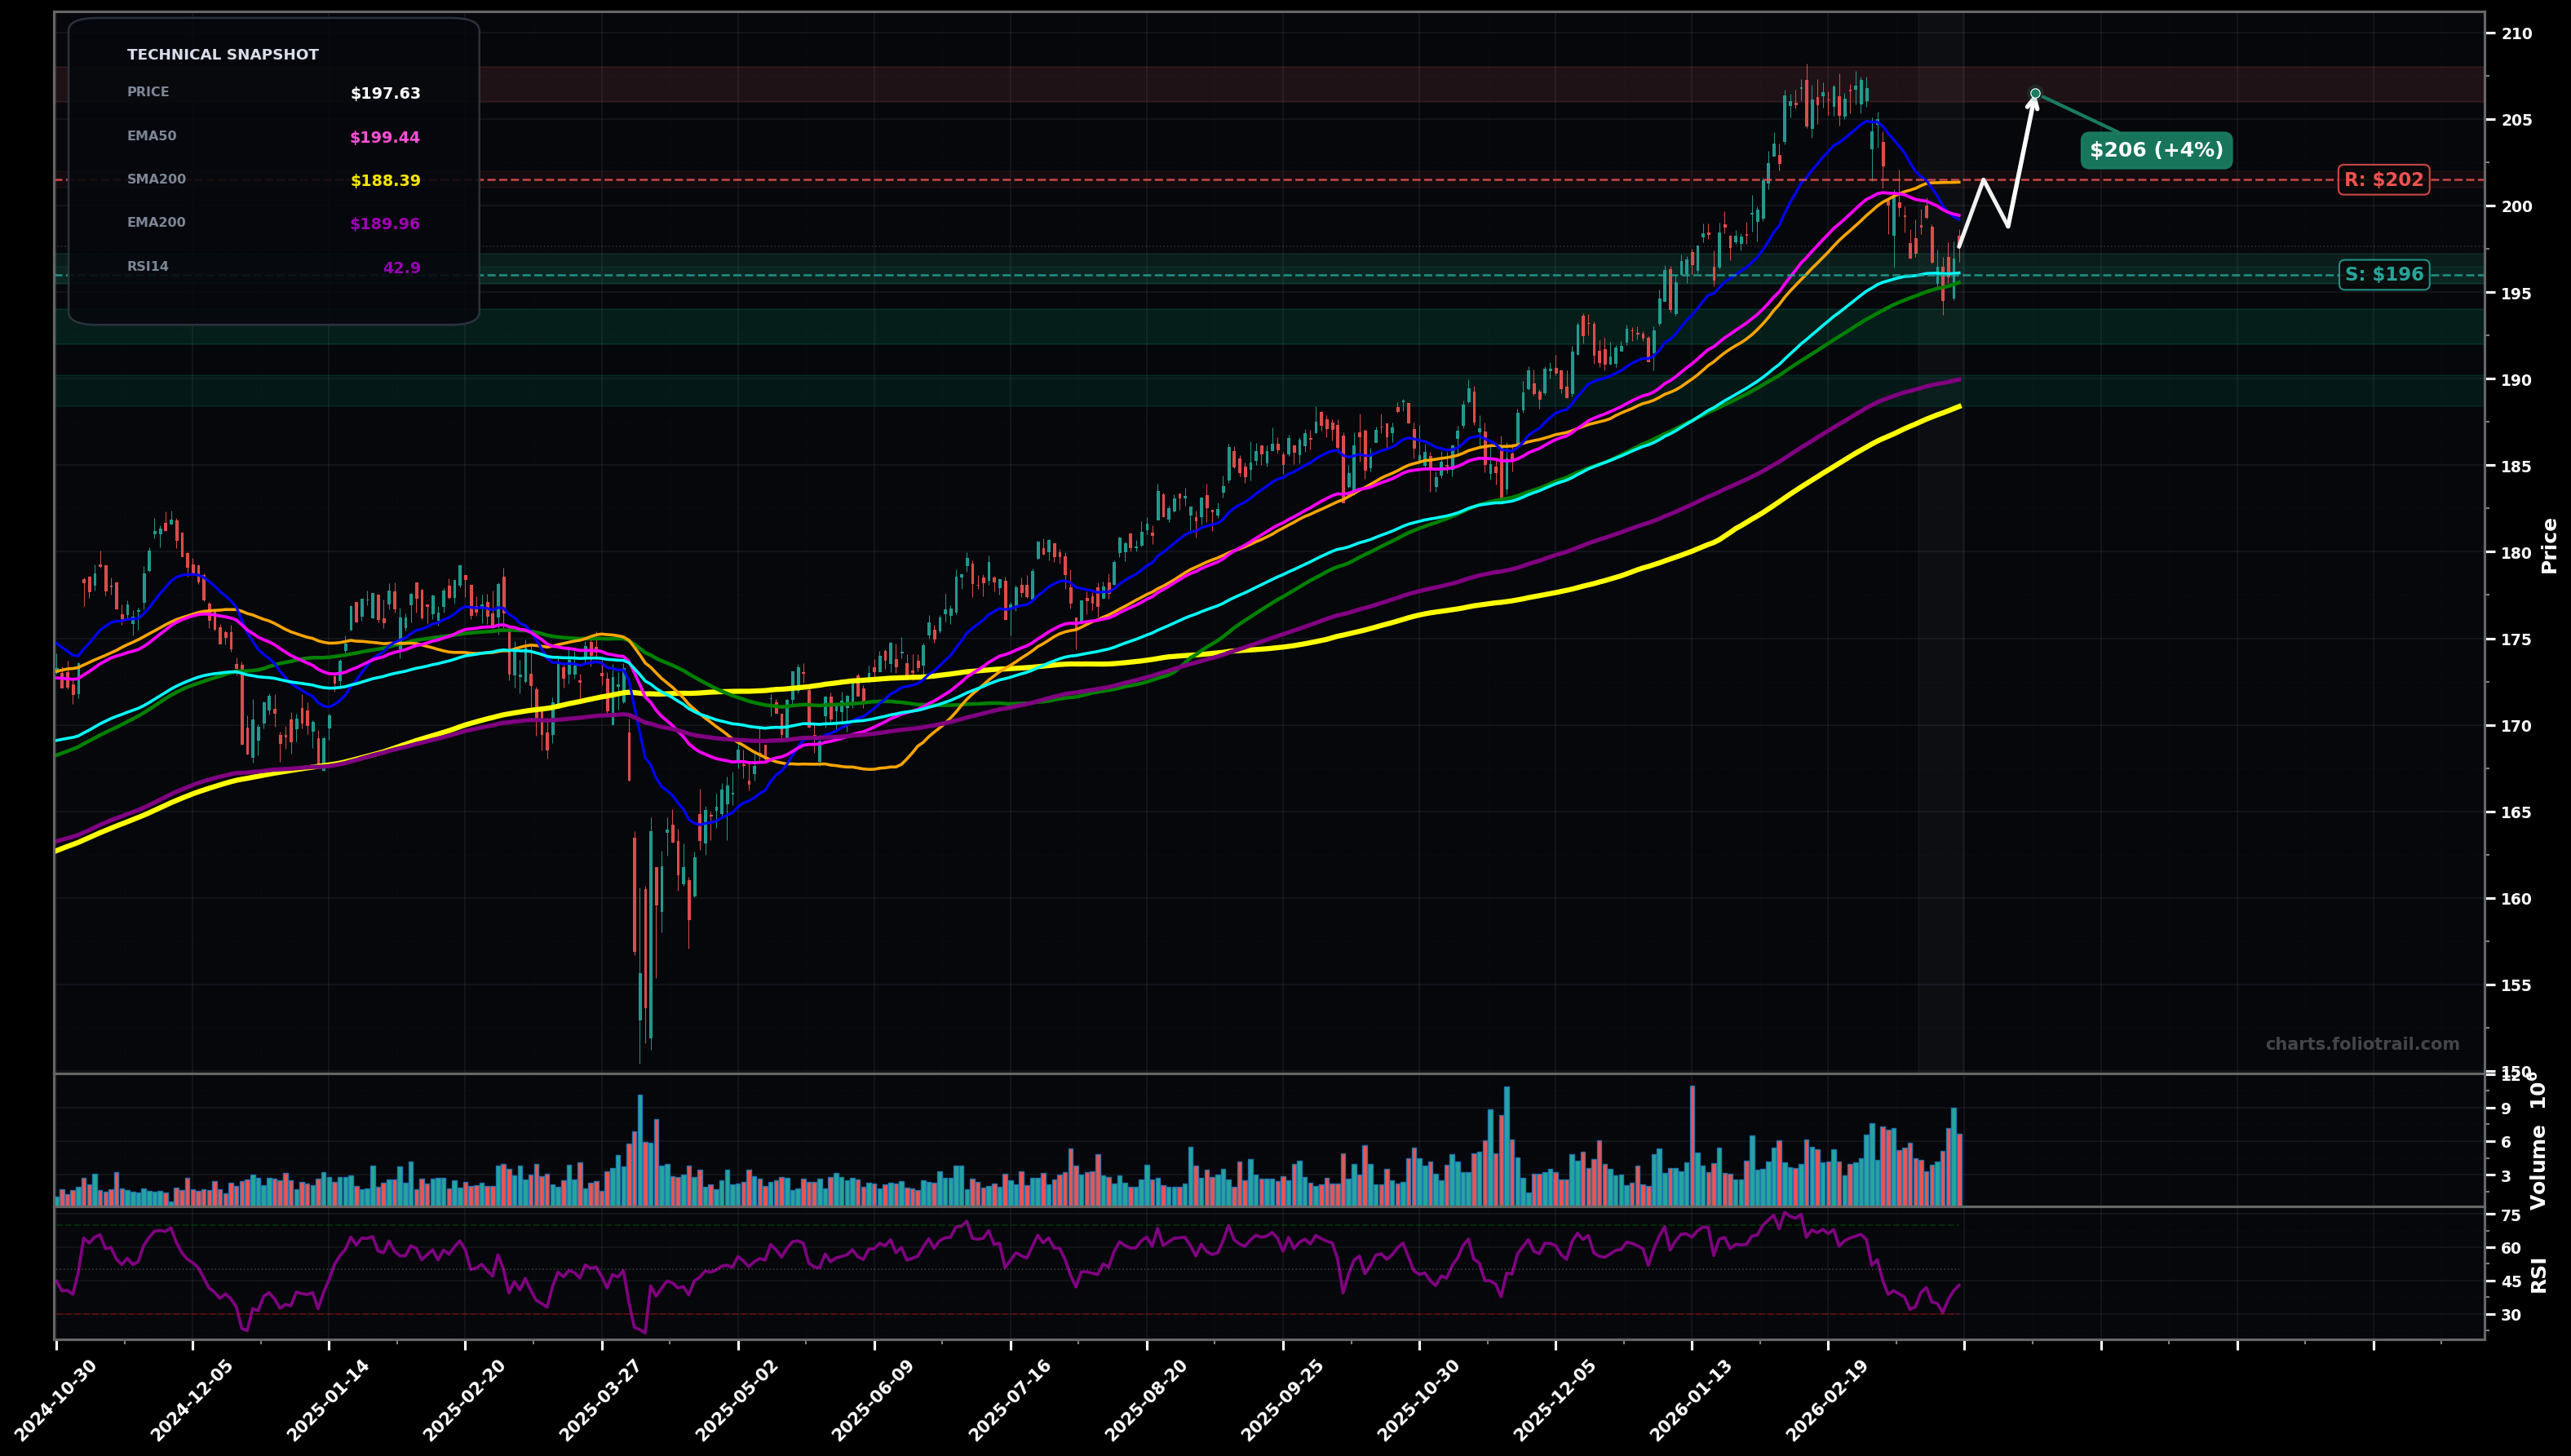
As of March 26, 2026, VTV (Vanguard Value ETF) is in a choppy range state on the daily chart, with a confidence level of 62%. Key support is at $196 and key resistance at $202. Sharp pullback from ~$206–$207 swing high into a lower-high consolidation; price ~$197.63 is below SMA50/EMA50 but still above EMA100/SMA100, with RSI ~42 showing cooling momentum.
Base-building above the $196 area (EMA100/SMA100 confluence) and a grind back to reclaim SMA50; then a retest of the prior breakdown zone near $205–$207.
Support gives way and the pullback extends toward the higher-timeframe trend supports (EMA200/SMA200), typical of an Elliott Wave ABC correction completing with a C-leg flush.
Daily close back above $201.50 followed by a second close holding above $201.50
Daily close below $195.50 (loss of SMA100/EMA100 cluster)
Scale-in around the EMA100/SMA100 support first; add on a deeper Fibonacci-style retrace toward ~$192, and deploy heavily into the EMA200/SMA200 zone where prior uptrend structure is most likely to defend.
Trim into prior swing-high supply ($206–$208) first; heavier trims if price stretches well above the rising MA stack, and fully exit only on an extended melt-up well beyond the prior peak (parabolic risk).
As of March 26, 2026, VTV (Vanguard Value ETF) is in a choppy range state on the daily chart with 62% confidence. Sharp pullback from ~$206–$207 swing high into a lower-high consolidation; price ~$197.63 is below SMA50/EMA50 but still above EMA100/SMA100, with RSI ~42 showing cooling momentum.
On the daily timeframe, VTV has key support at $196 and key resistance at $202. The most likely scenario (bullish) targets $202 and $206, with a revert level at $199.
VTV (Vanguard Value ETF) is currently classified as choppy range on the daily chart, with 62% confidence. Confirmation requires: Daily close back above $201.50 followed by a second close holding above $201.50 This would be invalidated by: Daily close below $195.50 (loss of SMA100/EMA100 cluster)
The most likely scenario (bullish) targets $202 and $206, with a revert level at $199. The alternative scenario (bearish) targets $192 and $188.
Multi-layer AI agents analyse 200+ stocks across daily, weekly, and monthly timeframes — producing market state classifications, price scenarios with targets, and position entry/exit levels. Updated every trading day after market close. No paywall. No sign-up required.
Built by Foliotrail.
All content on this website — including charts, analysis, price targets, support/resistance levels, and position zones — is generated entirely by AI and provided for educational and informational purposes only.
This is not financial advice. NEXUSNOIR VENTURES SL (the operator of this website) is not a registered investment adviser or broker-dealer. You should not make investment decisions based solely on this information. Always do your own research and consult a qualified financial advisor.
By continuing, you acknowledge that you have read and agree to our full disclaimer & terms of use and privacy policy.