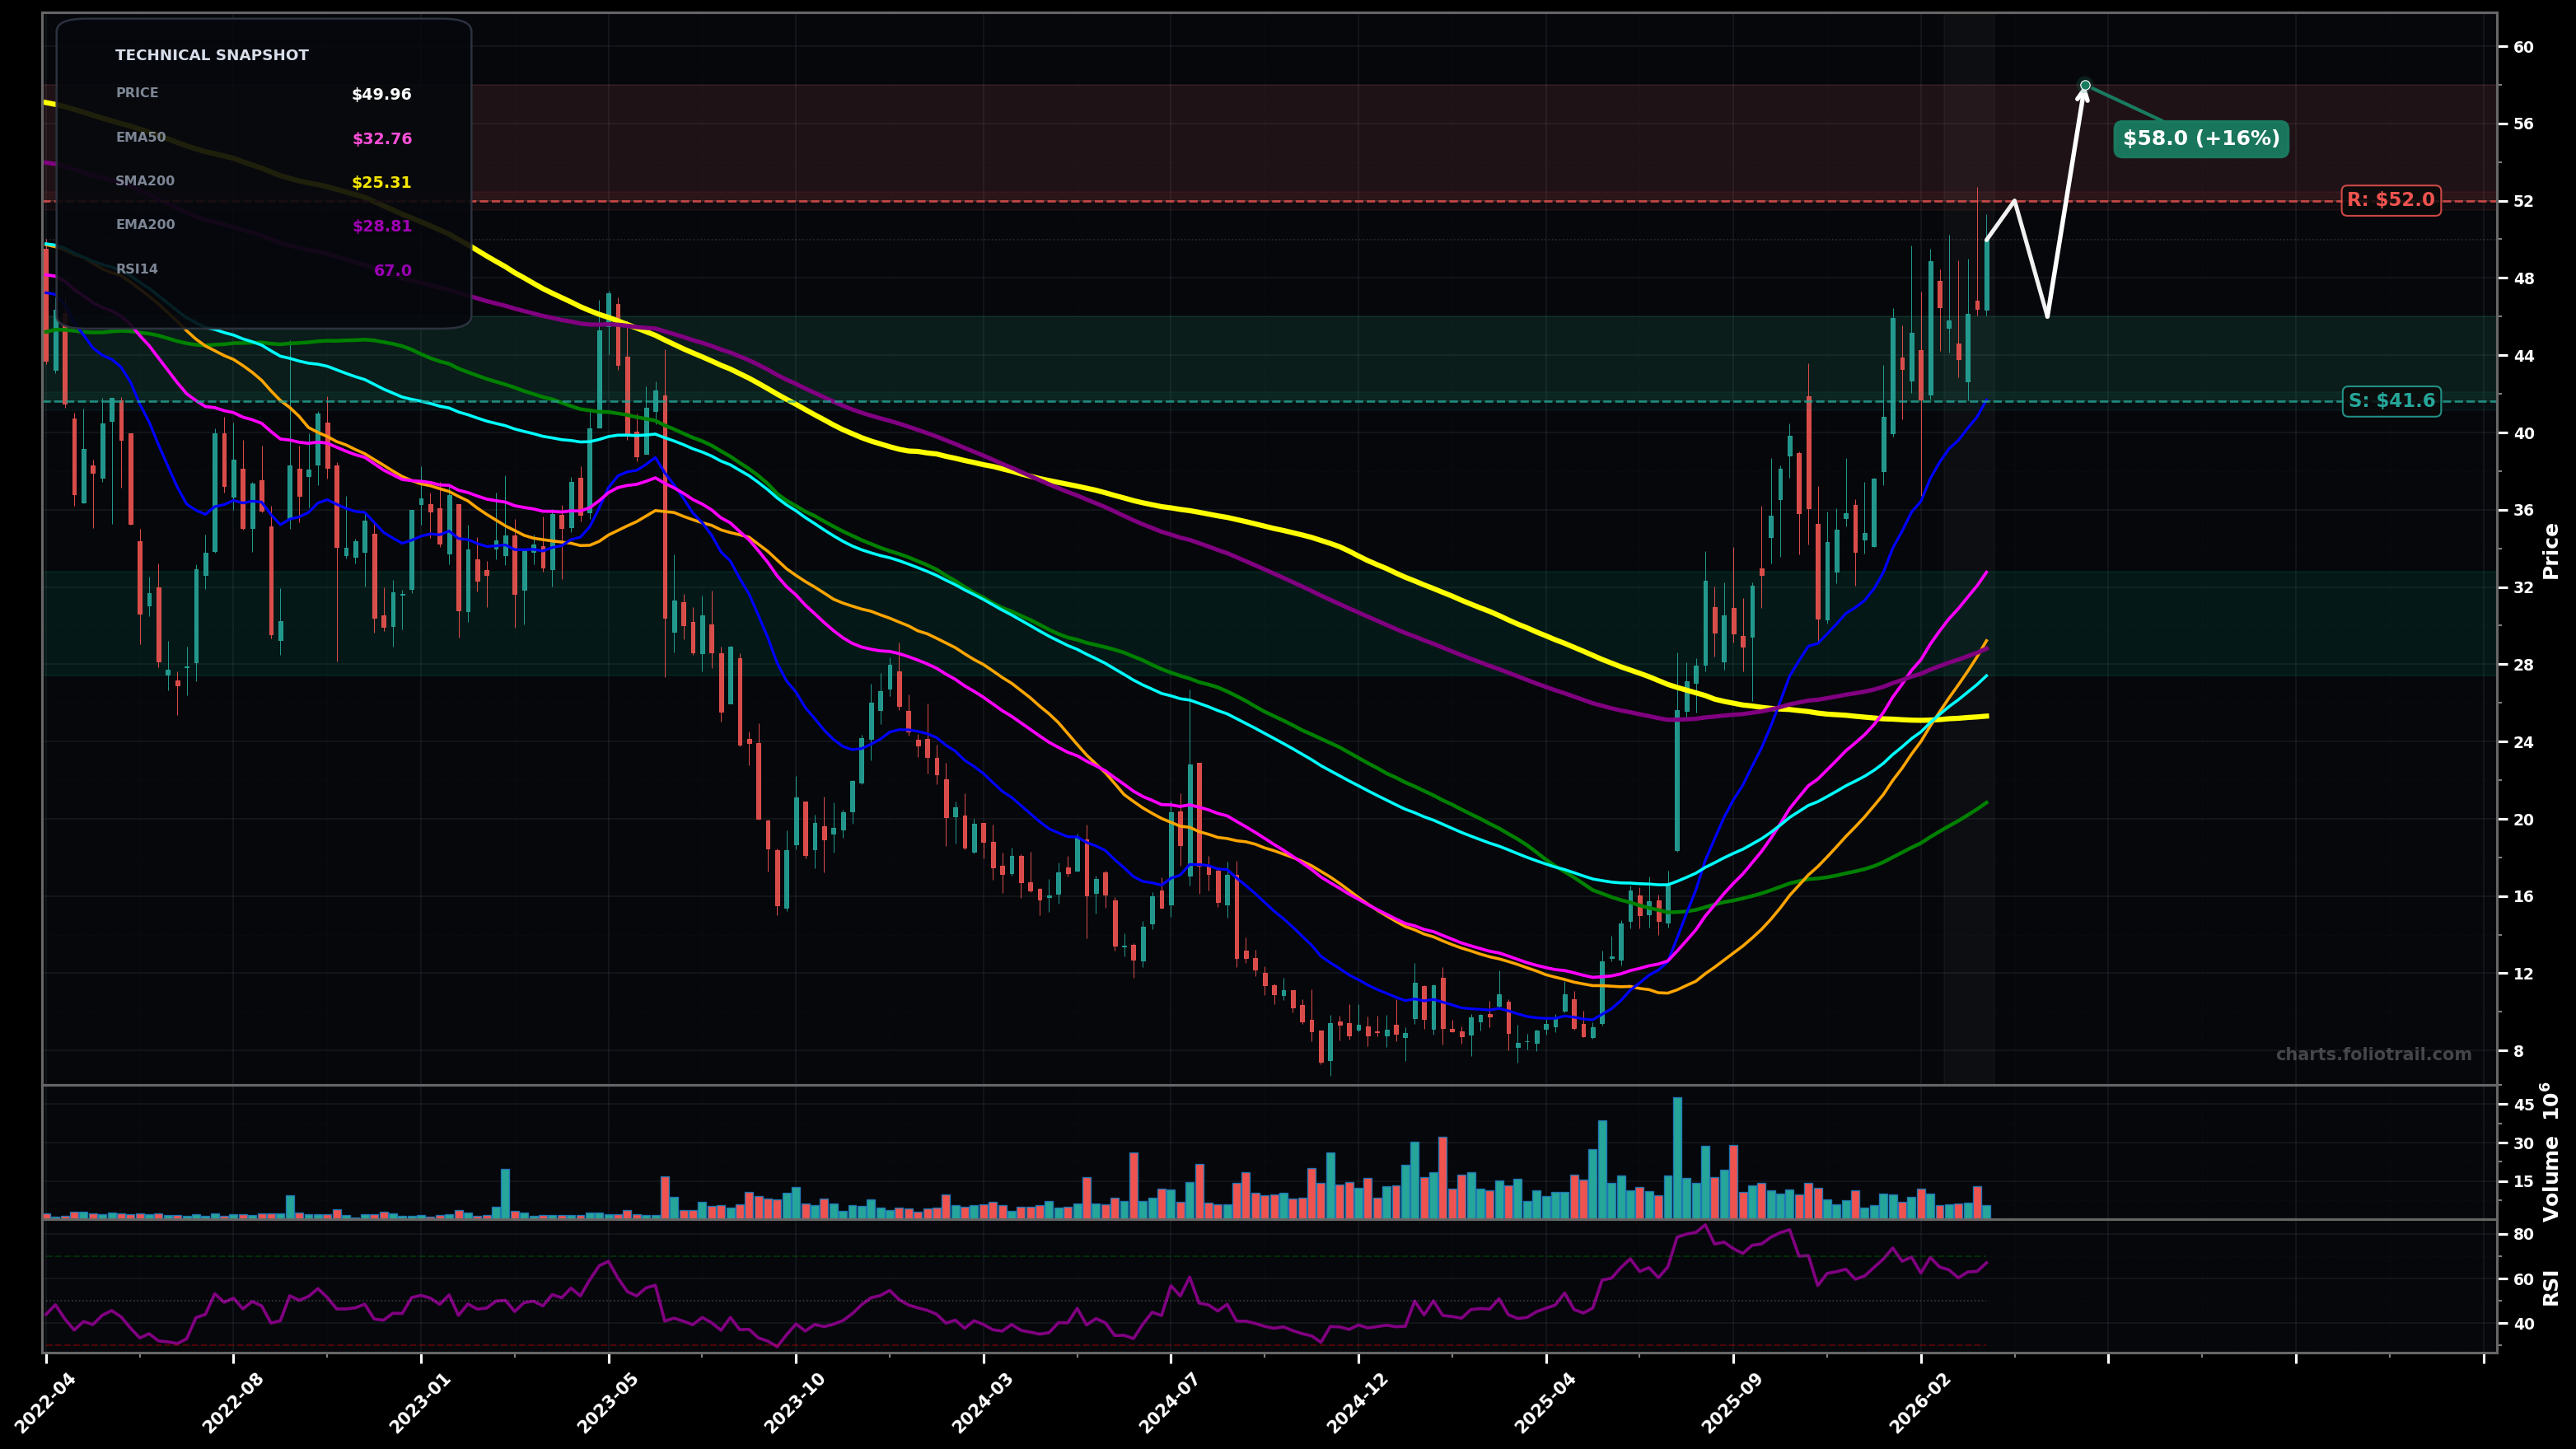
As of March 26, 2026, VSAT (Viasat Inc.) is in a parabolic state on the weekly chart, with a confidence level of 72%. Key support is at $41.6 and key resistance at $52.0. Strong weekly HH/HL advance; price ~$49.96 extended above rising EMA50/EMA100 with RSI ~67 and accelerating momentum since the mid-2025 breakout.
Continuation higher after a brief consolidation: price holds above EMA50 and grinds up; likely completing an Elliott impulsive leg (probable Wave 3 extension) with only shallow pullbacks.
Mean-reversion pullback: a Wave 4-type correction retraces into the prior breakout/MA confluence; price chops then attempts another push higher if support holds.
Weekly close above $52.00 with follow-through would confirm parabolic continuation
Weekly close below $41.60 (EMA50) would invalidate the parabolic state and shift to a deeper correction/base
Buy-the-dip framework around EMA50 first, then deeper adds at EMA20/EMA100 area ($32.8/$27.4) which aligns with typical Wave-4 + Fib 0.382–0.50 retrace of the 2025 impulse.
Trim into strength at new highs/upper extensions (likely Fib 1.272–1.618 of the latest swing) since price is already materially stretched above EMA50/EMA100 and parabolic phases often revert sharply.
As of March 26, 2026, VSAT (Viasat Inc.) is in a parabolic state on the weekly chart with 72% confidence. Strong weekly HH/HL advance; price ~$49.96 extended above rising EMA50/EMA100 with RSI ~67 and accelerating momentum since the mid-2025 breakout.
On the weekly timeframe, VSAT has key support at $41.6 and key resistance at $52.0. The most likely scenario (bullish) targets $52.0 and $58.0, with a revert level at $46.0.
VSAT (Viasat Inc.) is currently classified as parabolic on the weekly chart, with 72% confidence. Confirmation requires: Weekly close above $52.00 with follow-through would confirm parabolic continuation This would be invalidated by: Weekly close below $41.60 (EMA50) would invalidate the parabolic state and shift to a deeper correction/base
The most likely scenario (bullish) targets $52.0 and $58.0, with a revert level at $46.0. The alternative scenario (bearish) targets $41.6 and $32.8.
Multi-layer AI agents analyse 200+ stocks across daily, weekly, and monthly timeframes — producing market state classifications, price scenarios with targets, and position entry/exit levels. Updated every trading day after market close. No paywall. No sign-up required.
Built by Foliotrail.
All content on this website — including charts, analysis, price targets, support/resistance levels, and position zones — is generated entirely by AI and provided for educational and informational purposes only.
This is not financial advice. NEXUSNOIR VENTURES SL (the operator of this website) is not a registered investment adviser or broker-dealer. You should not make investment decisions based solely on this information. Always do your own research and consult a qualified financial advisor.
By continuing, you acknowledge that you have read and agree to our full disclaimer & terms of use and privacy policy.