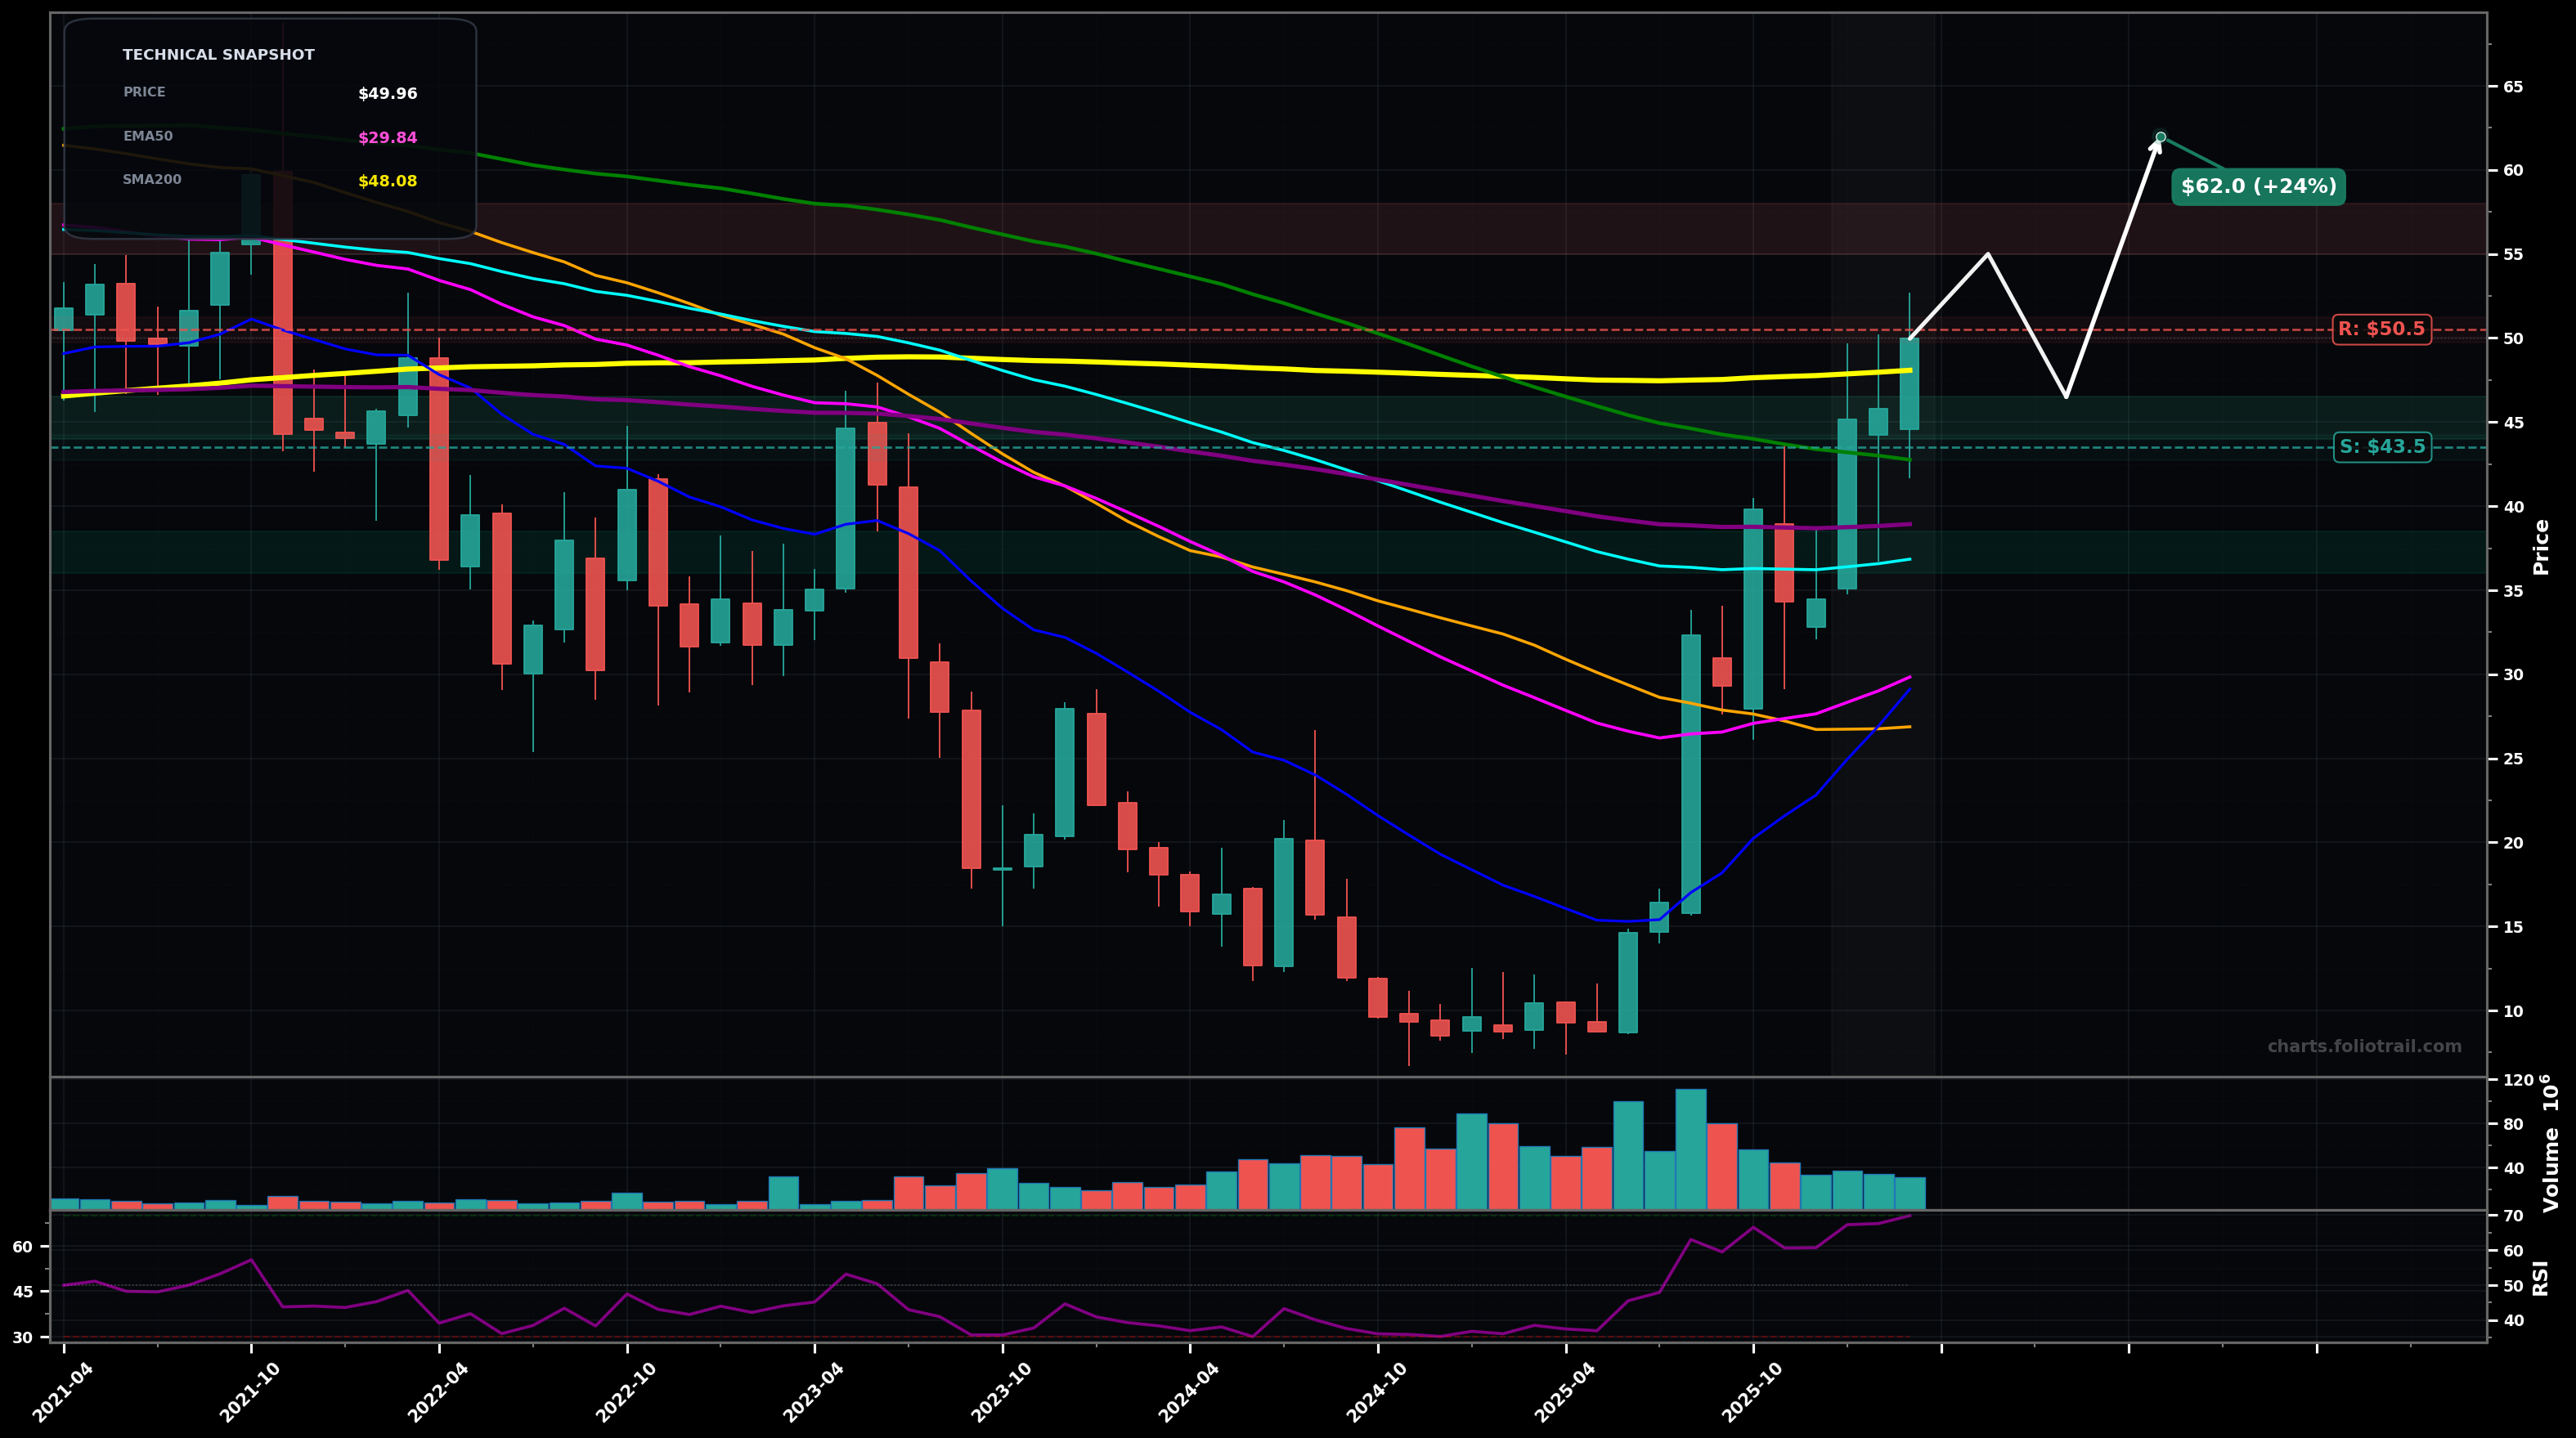
As of March 26, 2026, VSAT (Viasat Inc.) is in a breakout reversal state on the monthly chart, with a confidence level of 66%. Key support is at $43.5 and key resistance at $50.5. Strong impulsive rally from the 2025 base; price at ~$49.96 has pushed above EMA50/EMA100/EMA200 and is testing the long-term SMA200 (~$48.08) with RSI(14) ~69.9 (near overbought).
Bullish continuation: a brief consolidation above the reclaimed MA cluster (EMA200 ~ $38.93 / EMA100 ~ $36.84) and then a breakout over the SMA200/round-number supply, extending the advance (likely Elliott Wave 3 continuation after a Wave 2 base).
Bearish pullback: rejection near ~$50-$52 (SMA200/psychological level) leading to a deeper retrace toward the prior breakout zone (Fibonacci-style 38.2%–61.8% of the latest impulse), while keeping the larger reversal thesis intact unless $43.50 breaks.
Monthly close > $50.50 with a follow-through close holding above $48.00
Monthly close < $43.50 (back below the prior breakout/MA cluster)
Buy-the-dip zones are anchored to the reclaimed breakout area ($44-$46.5), then prior resistance/support flip ($40.5-$43.5), then the dense MA confluence/EMA200 region (~$38-$39) as a last deeper retrace.
Trim into strength as price stretches above the SMA200 with RSI elevated; higher trim bands align with plausible measured-move/extension zones after clearing the long-term downtrend regime.
As of March 26, 2026, VSAT (Viasat Inc.) is in a breakout reversal state on the monthly chart with 66% confidence. Strong impulsive rally from the 2025 base; price at ~$49.96 has pushed above EMA50/EMA100/EMA200 and is testing the long-term SMA200 (~$48.08) with RSI(14) ~69.9 (near overbought).
On the monthly timeframe, VSAT has key support at $43.5 and key resistance at $50.5. The most likely scenario (bullish) targets $55.0 and $62.0, with a revert level at $46.5.
VSAT (Viasat Inc.) is currently classified as breakout reversal on the monthly chart, with 66% confidence. Confirmation requires: Monthly close > $50.50 with a follow-through close holding above $48.00 This would be invalidated by: Monthly close < $43.50 (back below the prior breakout/MA cluster)
The most likely scenario (bullish) targets $55.0 and $62.0, with a revert level at $46.5. The alternative scenario (bearish) targets $41.0 and $36.5.
Multi-layer AI agents analyse 200+ stocks across daily, weekly, and monthly timeframes — producing market state classifications, price scenarios with targets, and position entry/exit levels. Updated every trading day after market close. No paywall. No sign-up required.
Built by Foliotrail.
All content on this website — including charts, analysis, price targets, support/resistance levels, and position zones — is generated entirely by AI and provided for educational and informational purposes only.
This is not financial advice. NEXUSNOIR VENTURES SL (the operator of this website) is not a registered investment adviser or broker-dealer. You should not make investment decisions based solely on this information. Always do your own research and consult a qualified financial advisor.
By continuing, you acknowledge that you have read and agree to our full disclaimer & terms of use and privacy policy.