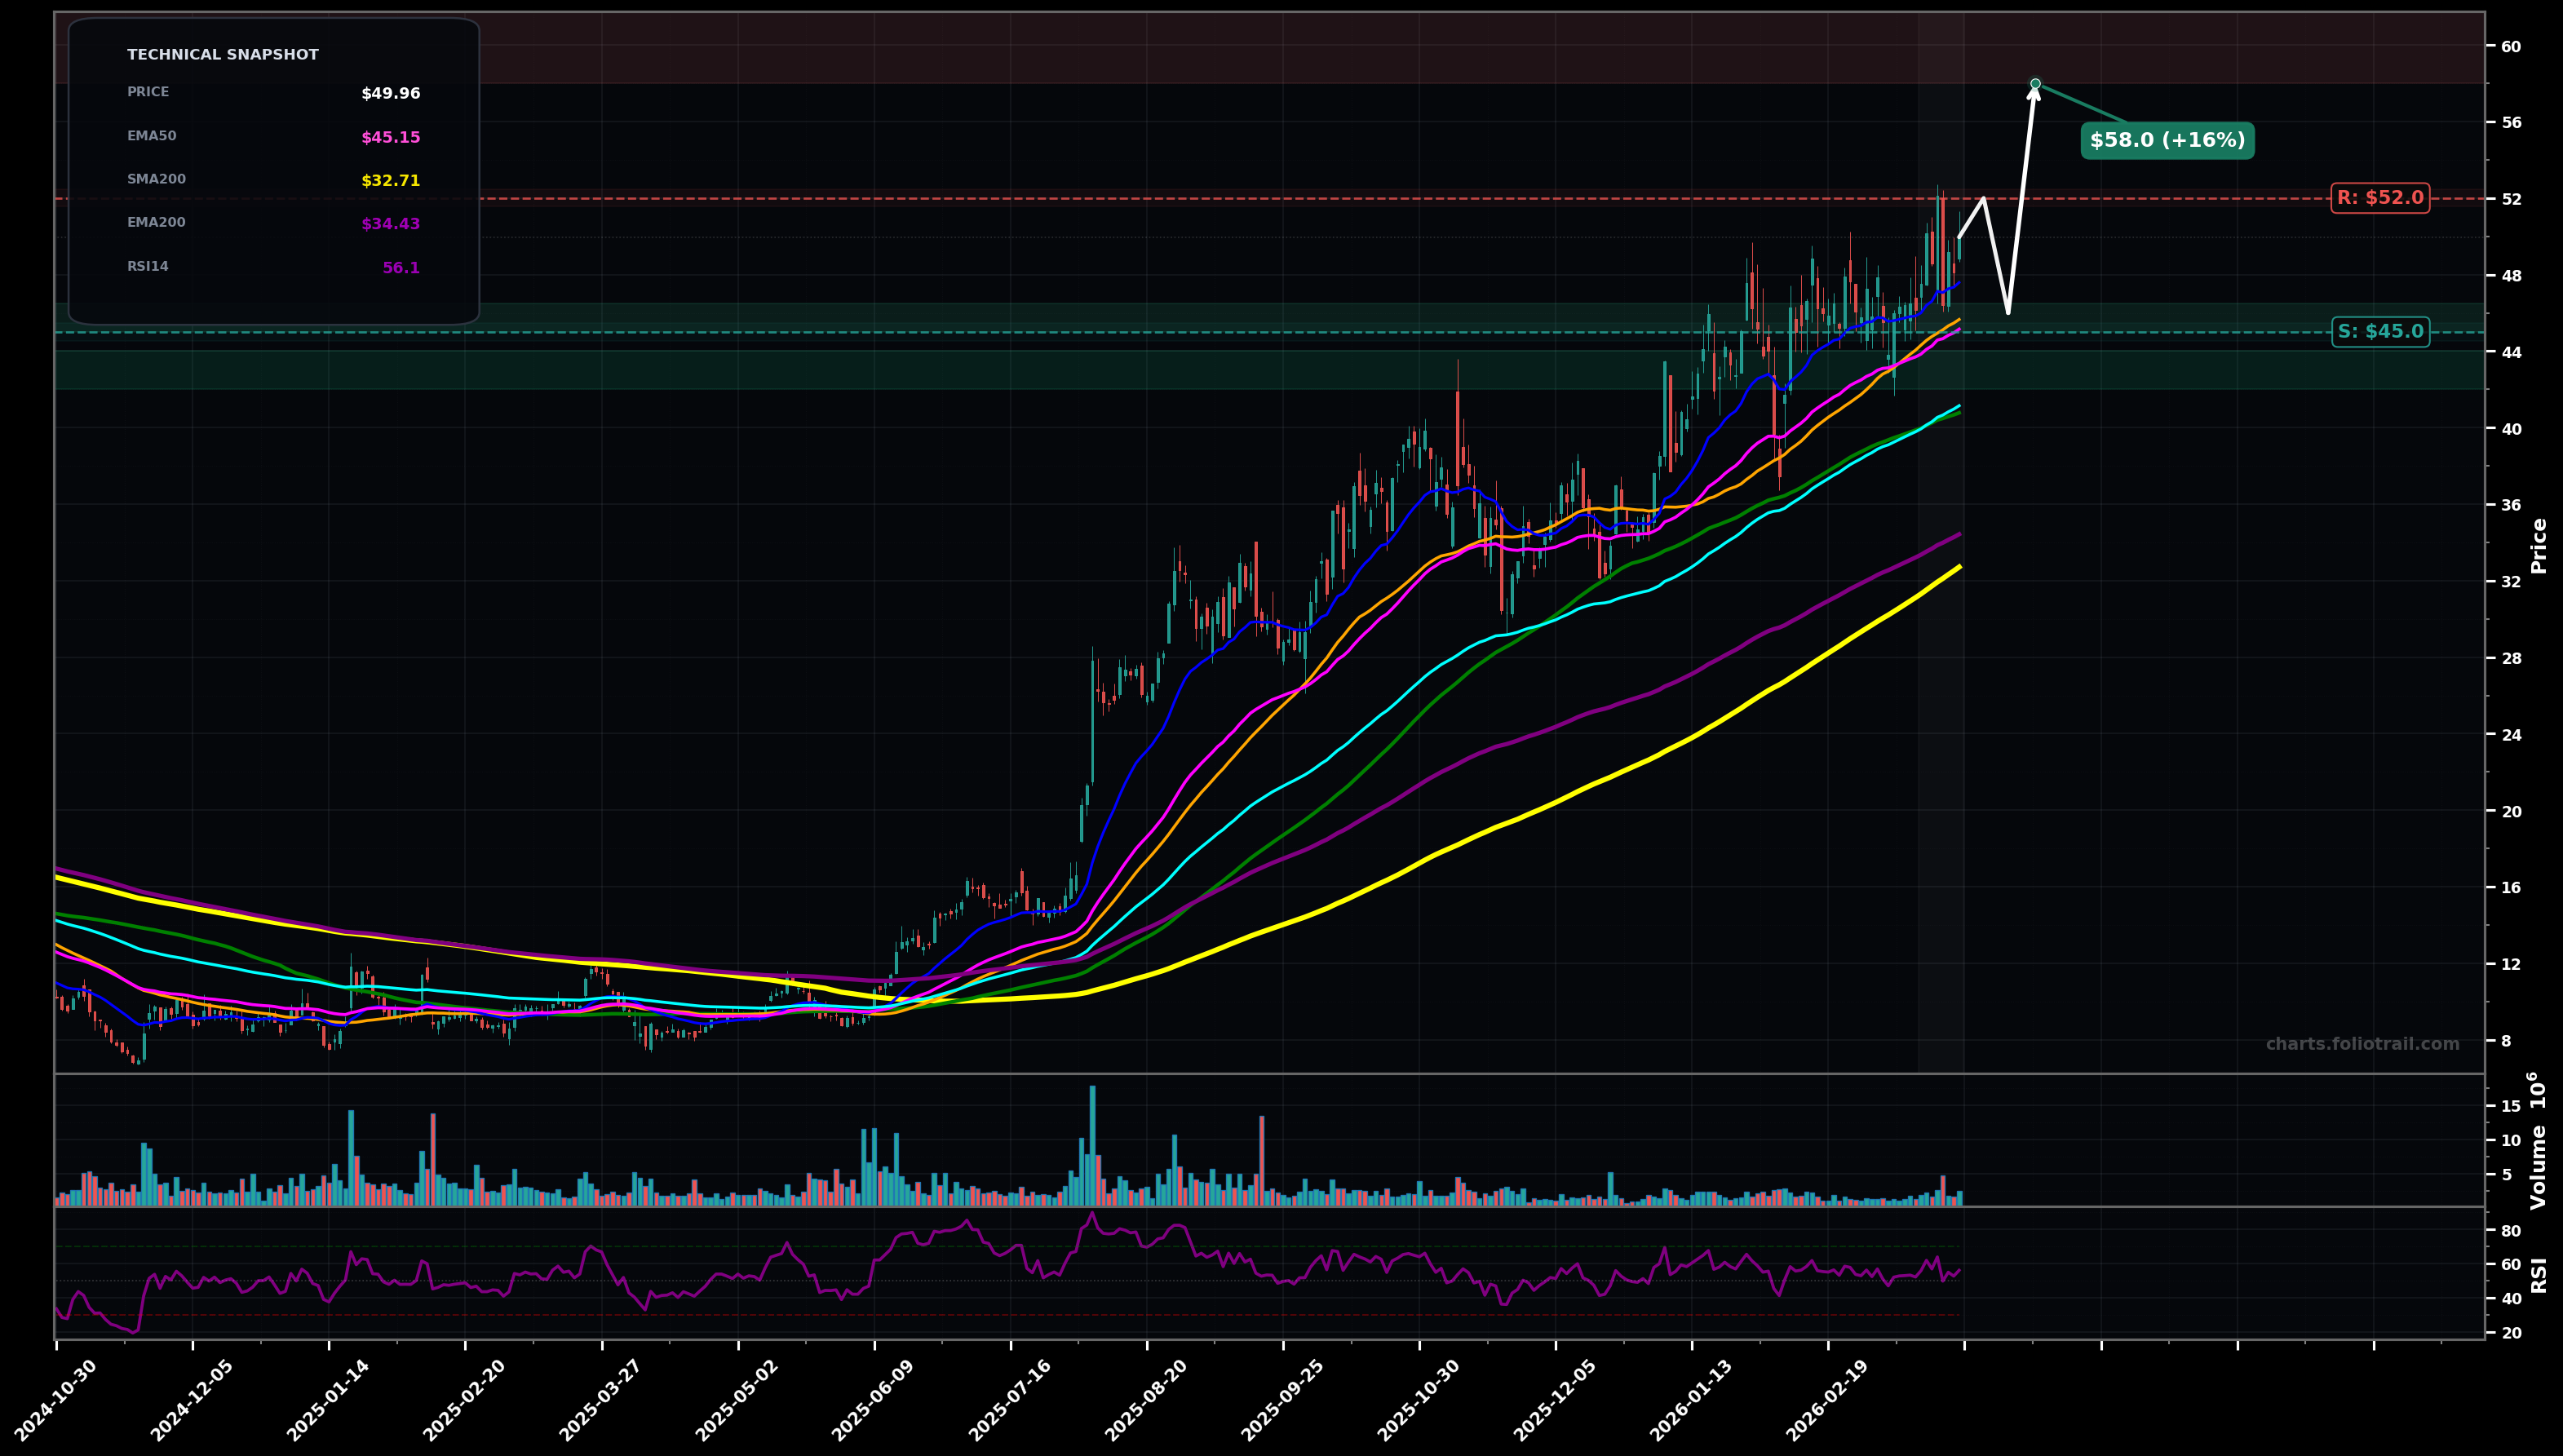
As of March 26, 2026, VSAT (Viasat Inc.) is in a uptrend state on the daily chart, with a confidence level of 78%. Key support is at $45.0 and key resistance at $52.0. Price at ~$49.96 consolidating just below recent highs ($51-$52) while holding above the rising EMA50 (~$45.15); RSI ~56 (neutral-bullish).
Bullish continuation: brief consolidation/pullback that holds $45-$46, then breakout above $52 to resume the advance (likely wave 5 continuation / extension).
Bearish pullback: rejection at $51-$52 leads to a deeper retrace toward the EMA100/SMA100 confluence before buyers re-engage (wave 4-style correction).
Daily close above $52.00 with follow-through (2+ closes holding above $52).
Daily close below $45.00 (loss of EMA50/SMA50 area) signals trend weakening and deeper pullback risk.
Start near rising EMA50/SMA50 support; add into EMA100/SMA100 pullback zone; heavy add near stronger trend support and prior breakout area (~$41) if a wave-4 retrace deepens.
Trim into extension/possible fib projection zones after a $52 breakout (momentum can get stretched above rising averages); progressively heavier trims on larger deviations from EMA50/EMA100 to manage mean-reversion risk.
As of March 26, 2026, VSAT (Viasat Inc.) is in a uptrend state on the daily chart with 78% confidence. Price at ~$49.96 consolidating just below recent highs ($51-$52) while holding above the rising EMA50 (~$45.15); RSI ~56 (neutral-bullish).
On the daily timeframe, VSAT has key support at $45.0 and key resistance at $52.0. The most likely scenario (bullish) targets $52.0 and $58.0, with a revert level at $46.0.
VSAT (Viasat Inc.) is currently classified as uptrend on the daily chart, with 78% confidence. Confirmation requires: Daily close above $52.00 with follow-through (2+ closes holding above $52). This would be invalidated by: Daily close below $45.00 (loss of EMA50/SMA50 area) signals trend weakening and deeper pullback risk.
The most likely scenario (bullish) targets $52.0 and $58.0, with a revert level at $46.0. The alternative scenario (bearish) targets $42.0 and $40.8.
Multi-layer AI agents analyse 200+ stocks across daily, weekly, and monthly timeframes — producing market state classifications, price scenarios with targets, and position entry/exit levels. Updated every trading day after market close. No paywall. No sign-up required.
Built by Foliotrail.
All content on this website — including charts, analysis, price targets, support/resistance levels, and position zones — is generated entirely by AI and provided for educational and informational purposes only.
This is not financial advice. NEXUSNOIR VENTURES SL (the operator of this website) is not a registered investment adviser or broker-dealer. You should not make investment decisions based solely on this information. Always do your own research and consult a qualified financial advisor.
By continuing, you acknowledge that you have read and agree to our full disclaimer & terms of use and privacy policy.