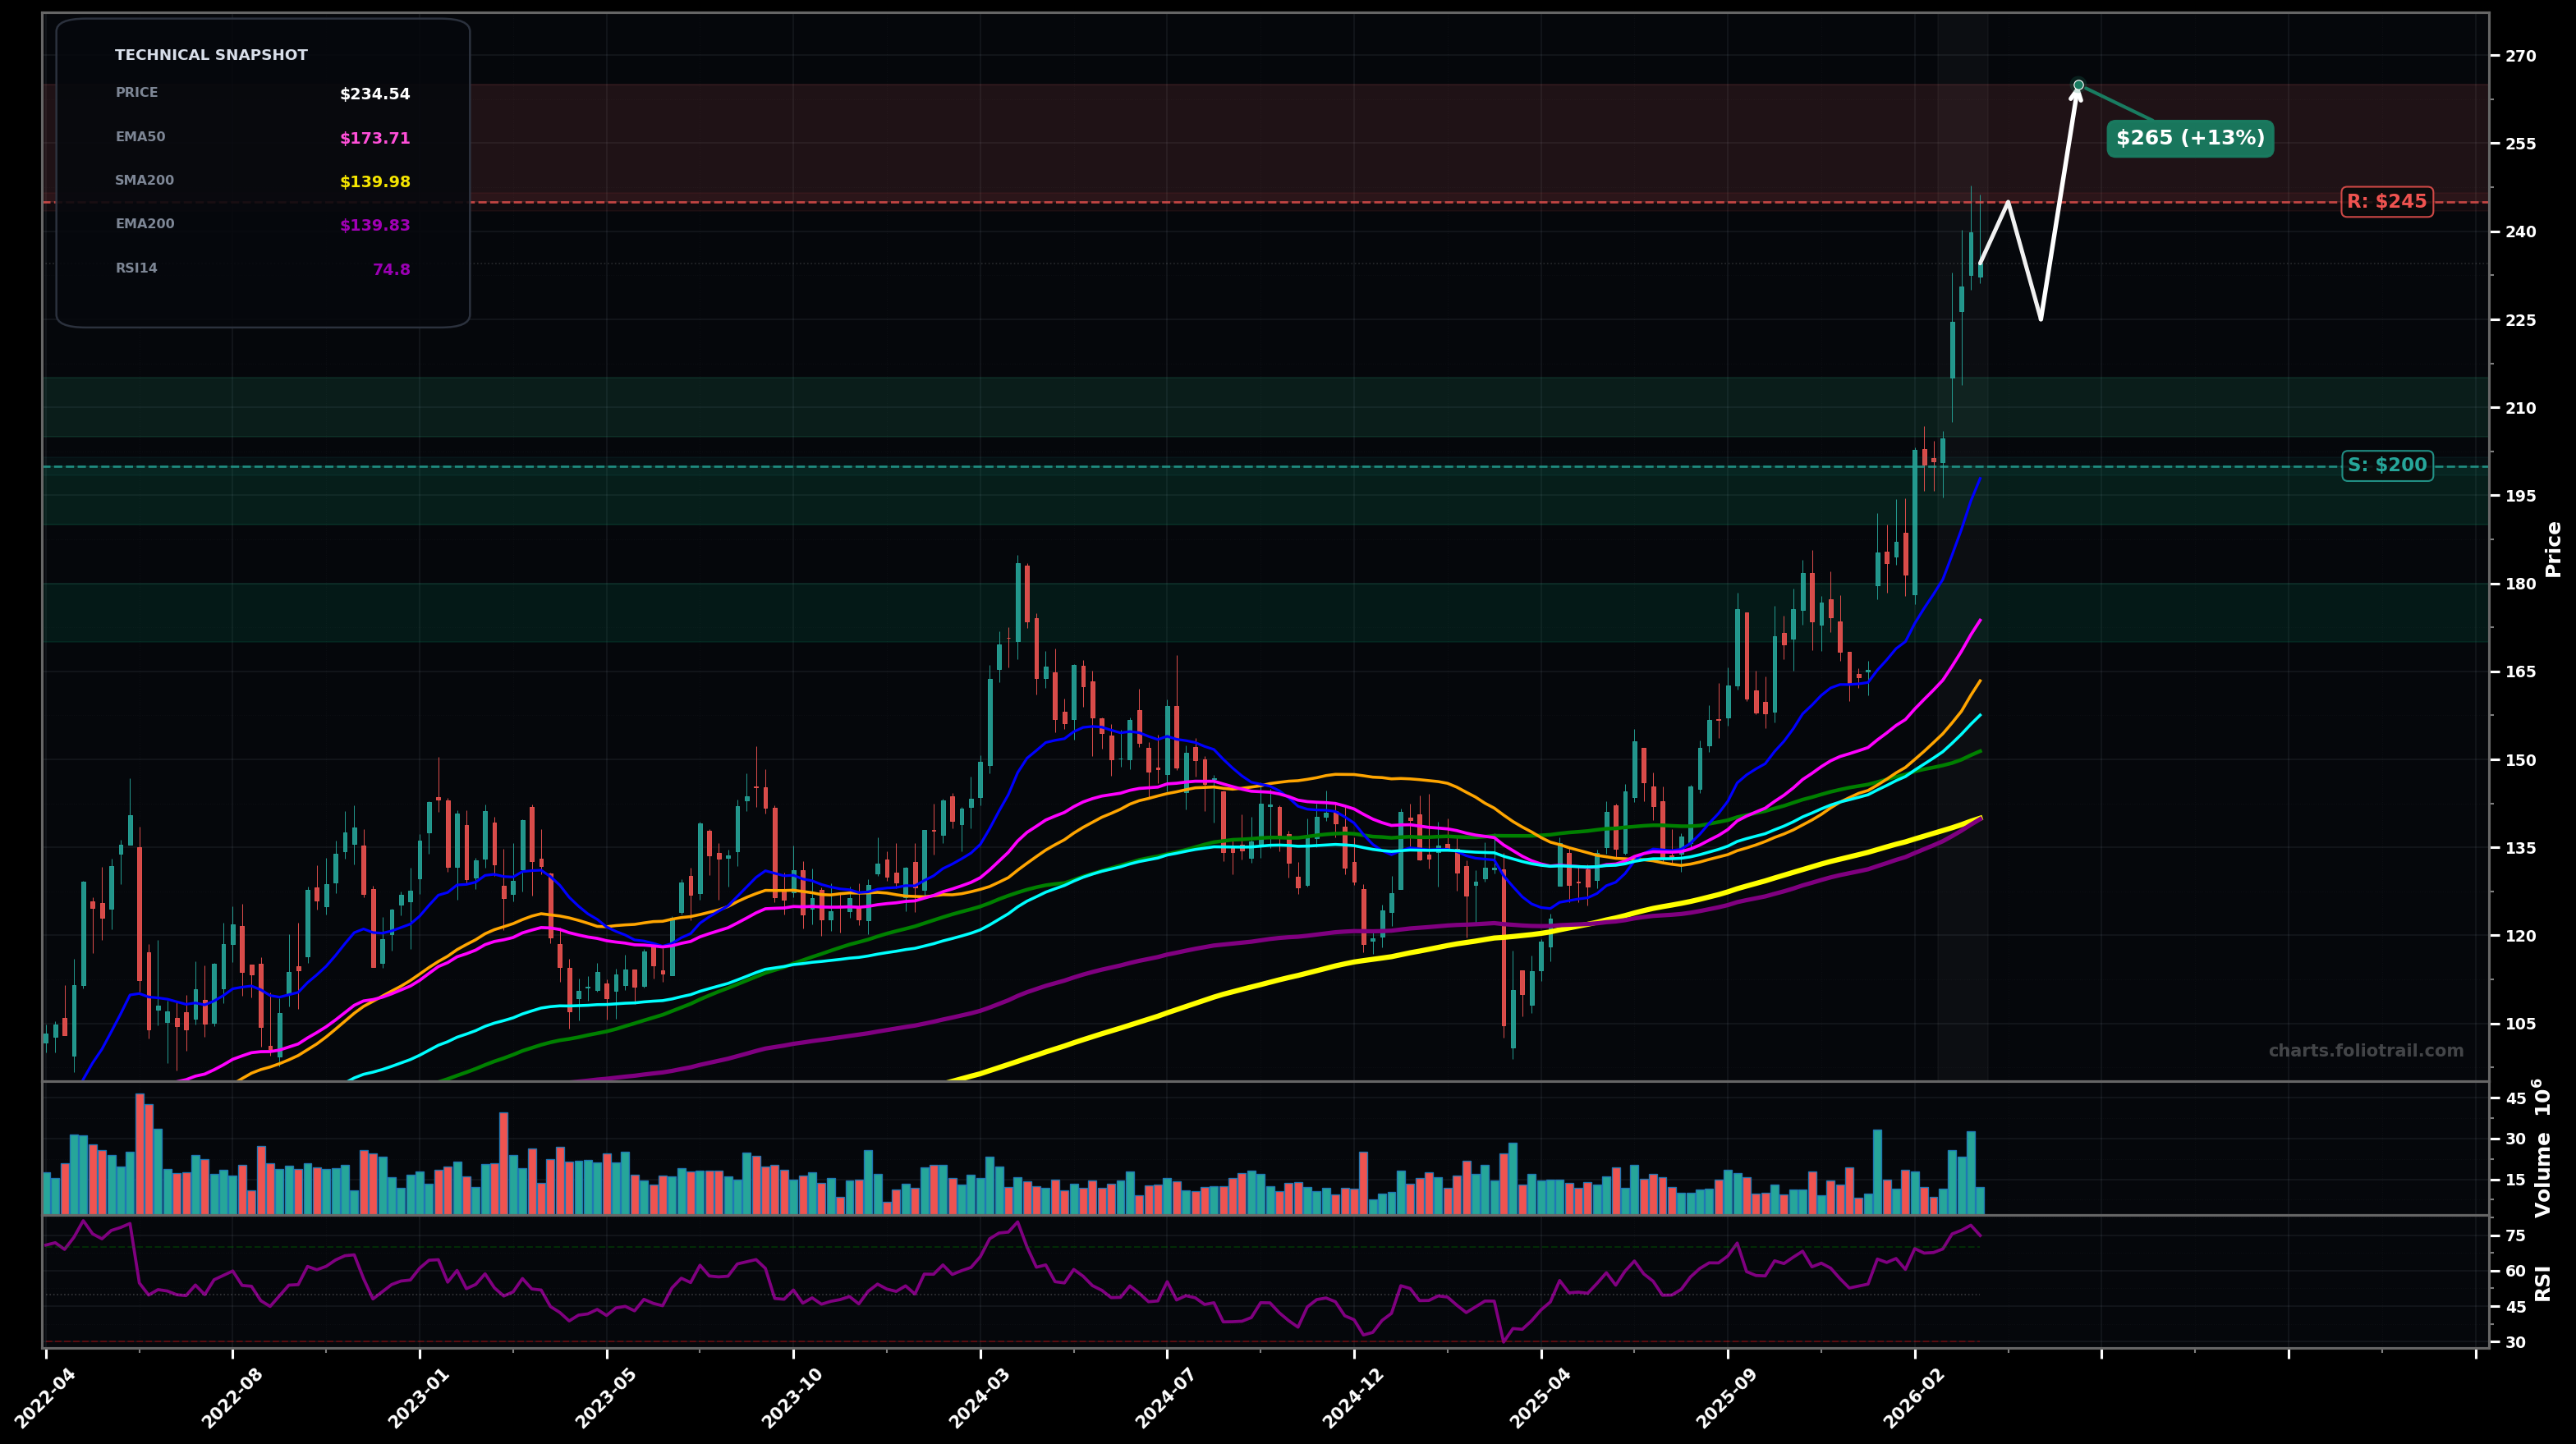
As of March 26, 2026, VLO (Valero Energy Corporation) is in a parabolic state on the weekly chart, with a confidence level of 74%. Key support is at $200 and key resistance at $245. Sharp weekly breakout to new highs with strong momentum; price far above all key MAs and RSI elevated (~75).
Continuation higher in a Wave 5 extension; brief consolidation then push to Fibonacci extension targets before a larger ABC pullback
Mean-reversion pullback (Wave 4 / start of ABC) back toward the breakout/EMA cluster; buyers defend prior resistance turned support
2 weekly closes holding above $225 would confirm continued parabolic continuation
A weekly close back below $200 would invalidate the parabolic continuation and signal a deeper mean-reversion
Buy-the-dip framework: $190-$200 is the key breakout retest zone; $170-$180 aligns with deeper Fib retrace/previous structure and reduces chasing risk after a parabolic run.
Price is already stretched vs EMA50/EMA100; trim into Fibonacci extension/psychological round-number zones where Wave 5 exhaustion and an ABC retrace become more probable.
As of March 26, 2026, VLO (Valero Energy Corporation) is in a parabolic state on the weekly chart with 74% confidence. Sharp weekly breakout to new highs with strong momentum; price far above all key MAs and RSI elevated (~75).
On the weekly timeframe, VLO has key support at $200 and key resistance at $245. The most likely scenario (bullish) targets $245 and $265, with a revert level at $225.
VLO (Valero Energy Corporation) is currently classified as parabolic on the weekly chart, with 74% confidence. Confirmation requires: 2 weekly closes holding above $225 would confirm continued parabolic continuation This would be invalidated by: A weekly close back below $200 would invalidate the parabolic continuation and signal a deeper mean-reversion
The most likely scenario (bullish) targets $245 and $265, with a revert level at $225. The alternative scenario (bearish) targets $210 and $175.
Multi-layer AI agents analyse 200+ stocks across daily, weekly, and monthly timeframes — producing market state classifications, price scenarios with targets, and position entry/exit levels. Updated every trading day after market close. No paywall. No sign-up required.
Built by Foliotrail.
All content on this website — including charts, analysis, price targets, support/resistance levels, and position zones — is generated entirely by AI and provided for educational and informational purposes only.
This is not financial advice. NEXUSNOIR VENTURES SL (the operator of this website) is not a registered investment adviser or broker-dealer. You should not make investment decisions based solely on this information. Always do your own research and consult a qualified financial advisor.
By continuing, you acknowledge that you have read and agree to our full disclaimer & terms of use and privacy policy.