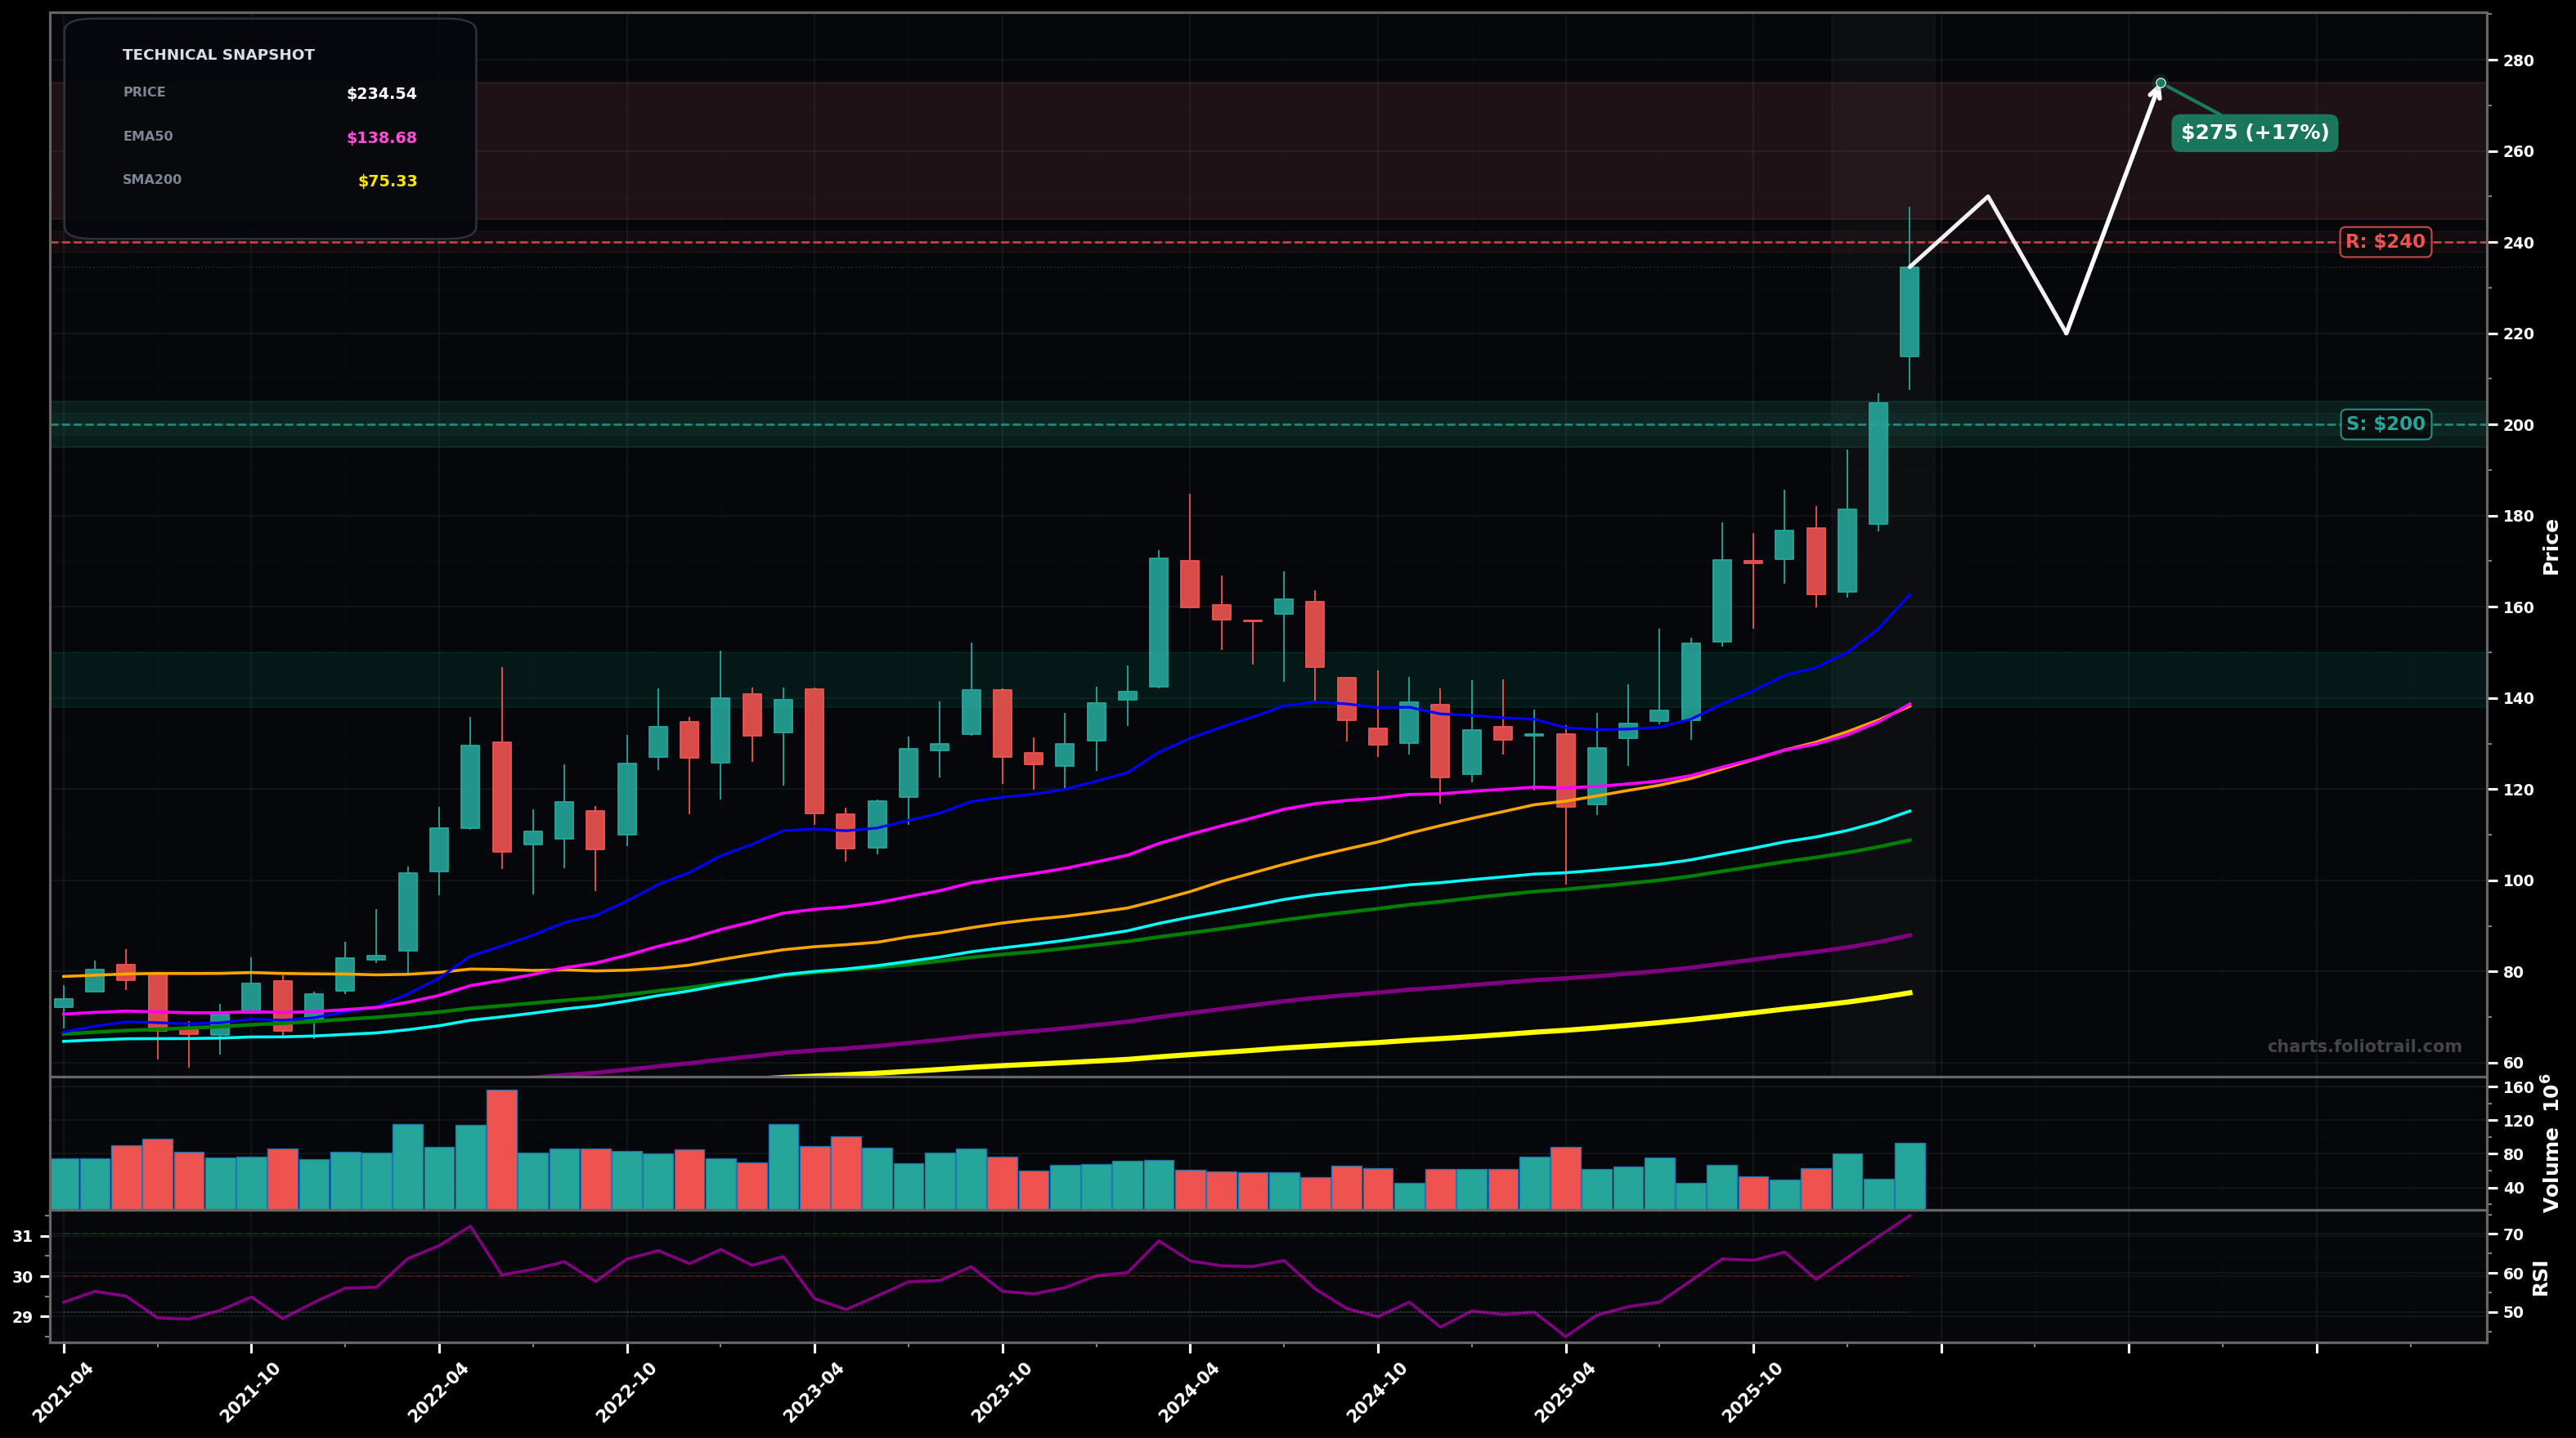
As of March 26, 2026, VLO (Valero Energy Corporation) is in a parabolic state on the monthly chart, with a confidence level of 72%. Key support is at $200 and key resistance at $240. Strong monthly breakout to new highs with expanding green candles; price stretched far above all key MAs and RSI elevated (~74.7).
Blow-off continuation: price makes one more push higher, then consolidates (tight range) above the breakout zone; Elliott view: likely late Wave 5 extension with a coming Wave A-B-C pullback risk after the final thrust.
Mean-reversion / Wave 4-style correction: price rejects near highs and retraces toward the prior breakout + rising EMA20/EMA50 area; Fibonacci expectation: 0.236–0.382 pullback of the most recent impulse (approx $200 then $175).
Monthly close > $240 keeps the parabolic advance intact
Monthly close < $200 would signal a failed blow-off and higher risk of a deeper mean-reversion
Buy-the-dip only: first interest at round-number + prior breakout support (~$200), add at prior swing zone (~$170-$182), heavy add near EMA50/SMA50 confluence (~$138-$150) if a deeper Wave A-B-C develops.
Trim into strength while price is extended far above EMA50/EMA100 and RSI overheated; larger trims/exit if price enters clear multi-year overextension (blow-off top risk) well above prior channel/impulse expectations.
As of March 26, 2026, VLO (Valero Energy Corporation) is in a parabolic state on the monthly chart with 72% confidence. Strong monthly breakout to new highs with expanding green candles; price stretched far above all key MAs and RSI elevated (~74.7).
On the monthly timeframe, VLO has key support at $200 and key resistance at $240. The most likely scenario (bullish) targets $250 and $275, with a revert level at $220.
VLO (Valero Energy Corporation) is currently classified as parabolic on the monthly chart, with 72% confidence. Confirmation requires: Monthly close > $240 keeps the parabolic advance intact This would be invalidated by: Monthly close < $200 would signal a failed blow-off and higher risk of a deeper mean-reversion
The most likely scenario (bullish) targets $250 and $275, with a revert level at $220. The alternative scenario (bearish) targets $200 and $175.
Multi-layer AI agents analyse 200+ stocks across daily, weekly, and monthly timeframes — producing market state classifications, price scenarios with targets, and position entry/exit levels. Updated every trading day after market close. No paywall. No sign-up required.
Built by Foliotrail.
All content on this website — including charts, analysis, price targets, support/resistance levels, and position zones — is generated entirely by AI and provided for educational and informational purposes only.
This is not financial advice. NEXUSNOIR VENTURES SL (the operator of this website) is not a registered investment adviser or broker-dealer. You should not make investment decisions based solely on this information. Always do your own research and consult a qualified financial advisor.
By continuing, you acknowledge that you have read and agree to our full disclaimer & terms of use and privacy policy.