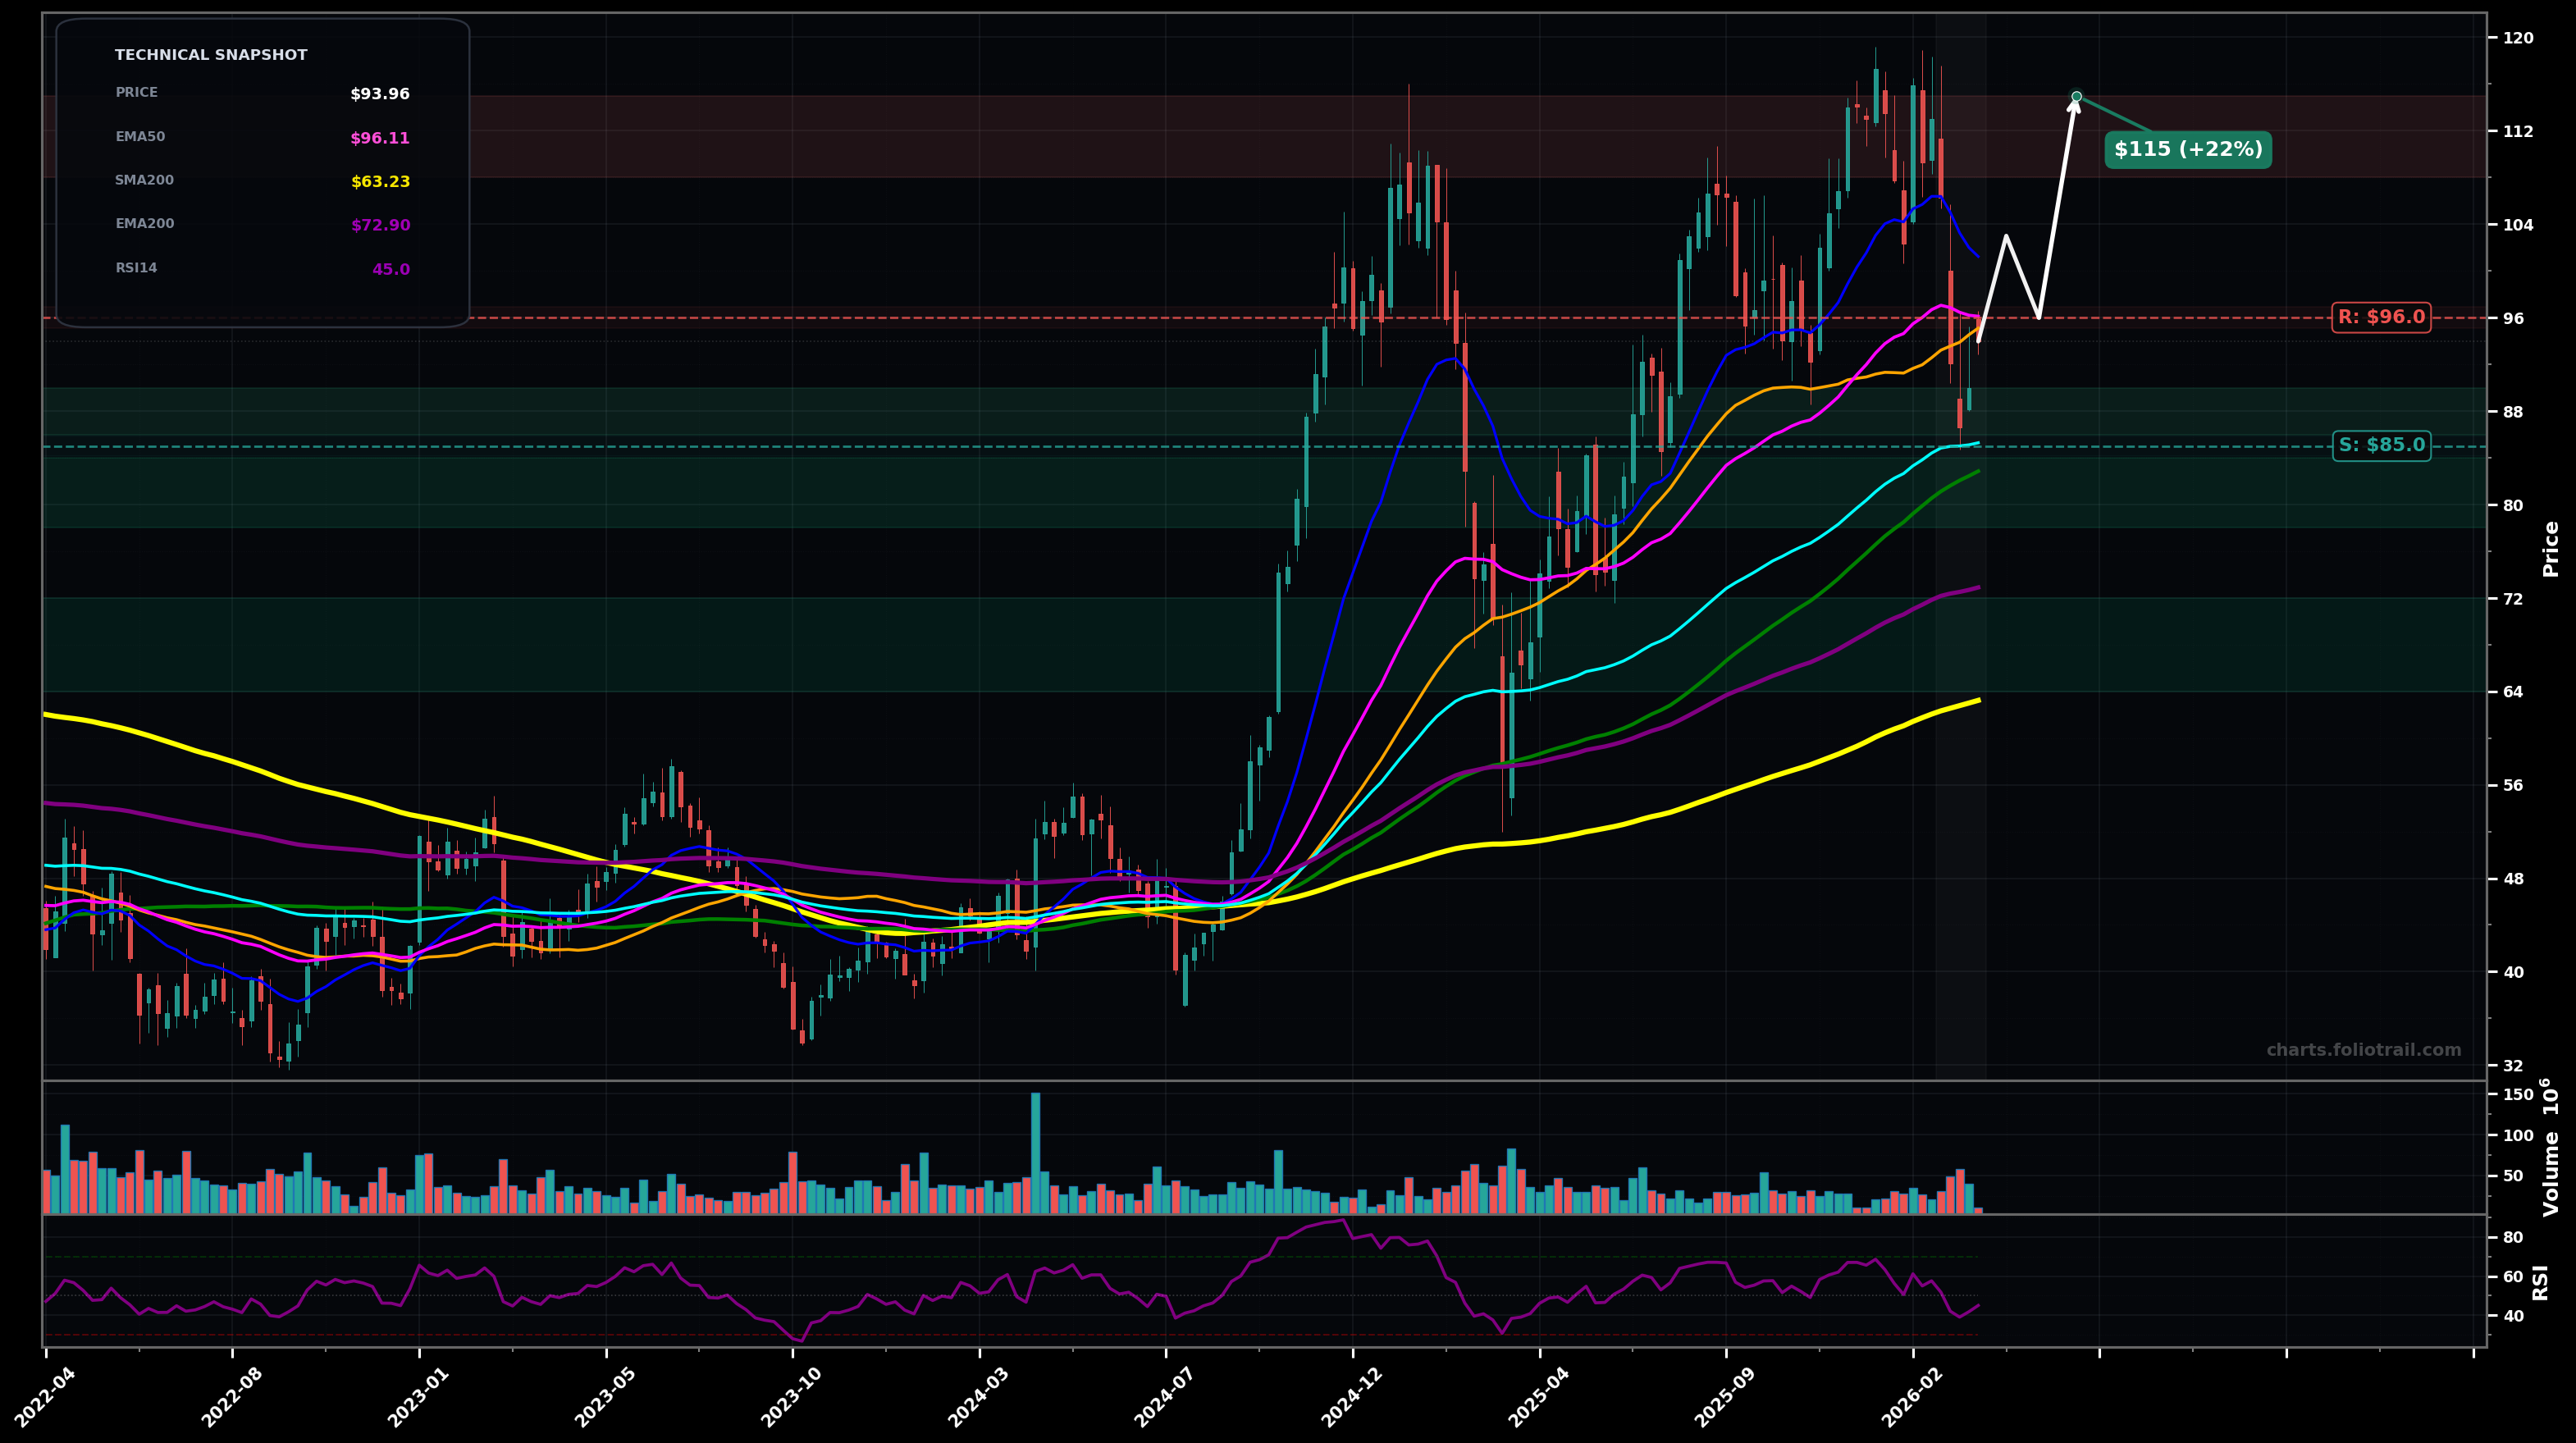
As of March 24, 2026, UAL (United Airlines Holdings Inc.) is in a bottoming attempt state on the weekly chart, with a confidence level of 56%. Key support is at $85.0 and key resistance at $96.0. Weekly pullback from the $115-$118 swing high; price ~$93.96 sitting below SMA50 (~$95.10) and slightly below EMA50 (~$96.11) but still above EMA100 (~$85.28); RSI14 ~45 (cooling, not oversold).
Base-and-bounce: price holds the $85-$88 area (EMA100 / prior pivot), forms a HL, then reclaims $96 to retest the $103-$108 supply zone (prior consolidation) with potential extension toward the $115-$118 swing high.
Deeper corrective leg: failure to reclaim $96 leads to another sell wave that breaks $85 and mean-reverts toward EMA200 (~$73) and then SMA200 (~$63), consistent with an Elliott Wave-style larger ABC correction after a completed impulsive advance.
2 weekly closes back above $96 (EMA50/SMA50 reclaim) with a follow-through higher close
Weekly close below $85 (loss of EMA100 and key swing support)
Start near EMA100/pivot support for a potential HL; add on a controlled breakdown toward EMA200; heavy add only near SMA200/major long-term support if the correction fully develops.
Trim into prior swing-high supply ($115-$118) and any extension beyond it; close if price becomes stretched well above rising EMA50/100 and pushes into a fresh upside extension zone.
As of March 24, 2026, UAL (United Airlines Holdings Inc.) is in a bottoming attempt state on the weekly chart with 56% confidence. Weekly pullback from the $115-$118 swing high; price ~$93.96 sitting below SMA50 (~$95.10) and slightly below EMA50 (~$96.11) but still above EMA100 (~$85.28); RSI14 ~45 (cooling, not oversold).
On the weekly timeframe, UAL has key support at $85.0 and key resistance at $96.0. The most likely scenario (bullish) targets $103 and $115, with a revert level at $96.0.
UAL (United Airlines Holdings Inc.) is currently classified as bottoming attempt on the weekly chart, with 56% confidence. Confirmation requires: 2 weekly closes back above $96 (EMA50/SMA50 reclaim) with a follow-through higher close This would be invalidated by: Weekly close below $85 (loss of EMA100 and key swing support)
The most likely scenario (bullish) targets $103 and $115, with a revert level at $96.0. The alternative scenario (bearish) targets $73.0 and $63.0.
All content on this website — including charts, analysis, price targets, support/resistance levels, and position zones — is generated entirely by AI and provided for educational and informational purposes only.
This is not financial advice. NEXUSNOIR VENTURES SL (the operator of this website) is not a registered investment adviser or broker-dealer. You should not make investment decisions based solely on this information. Always do your own research and consult a qualified financial advisor.
By continuing, you acknowledge that you have read and agree to our full disclaimer & terms of use and privacy policy.