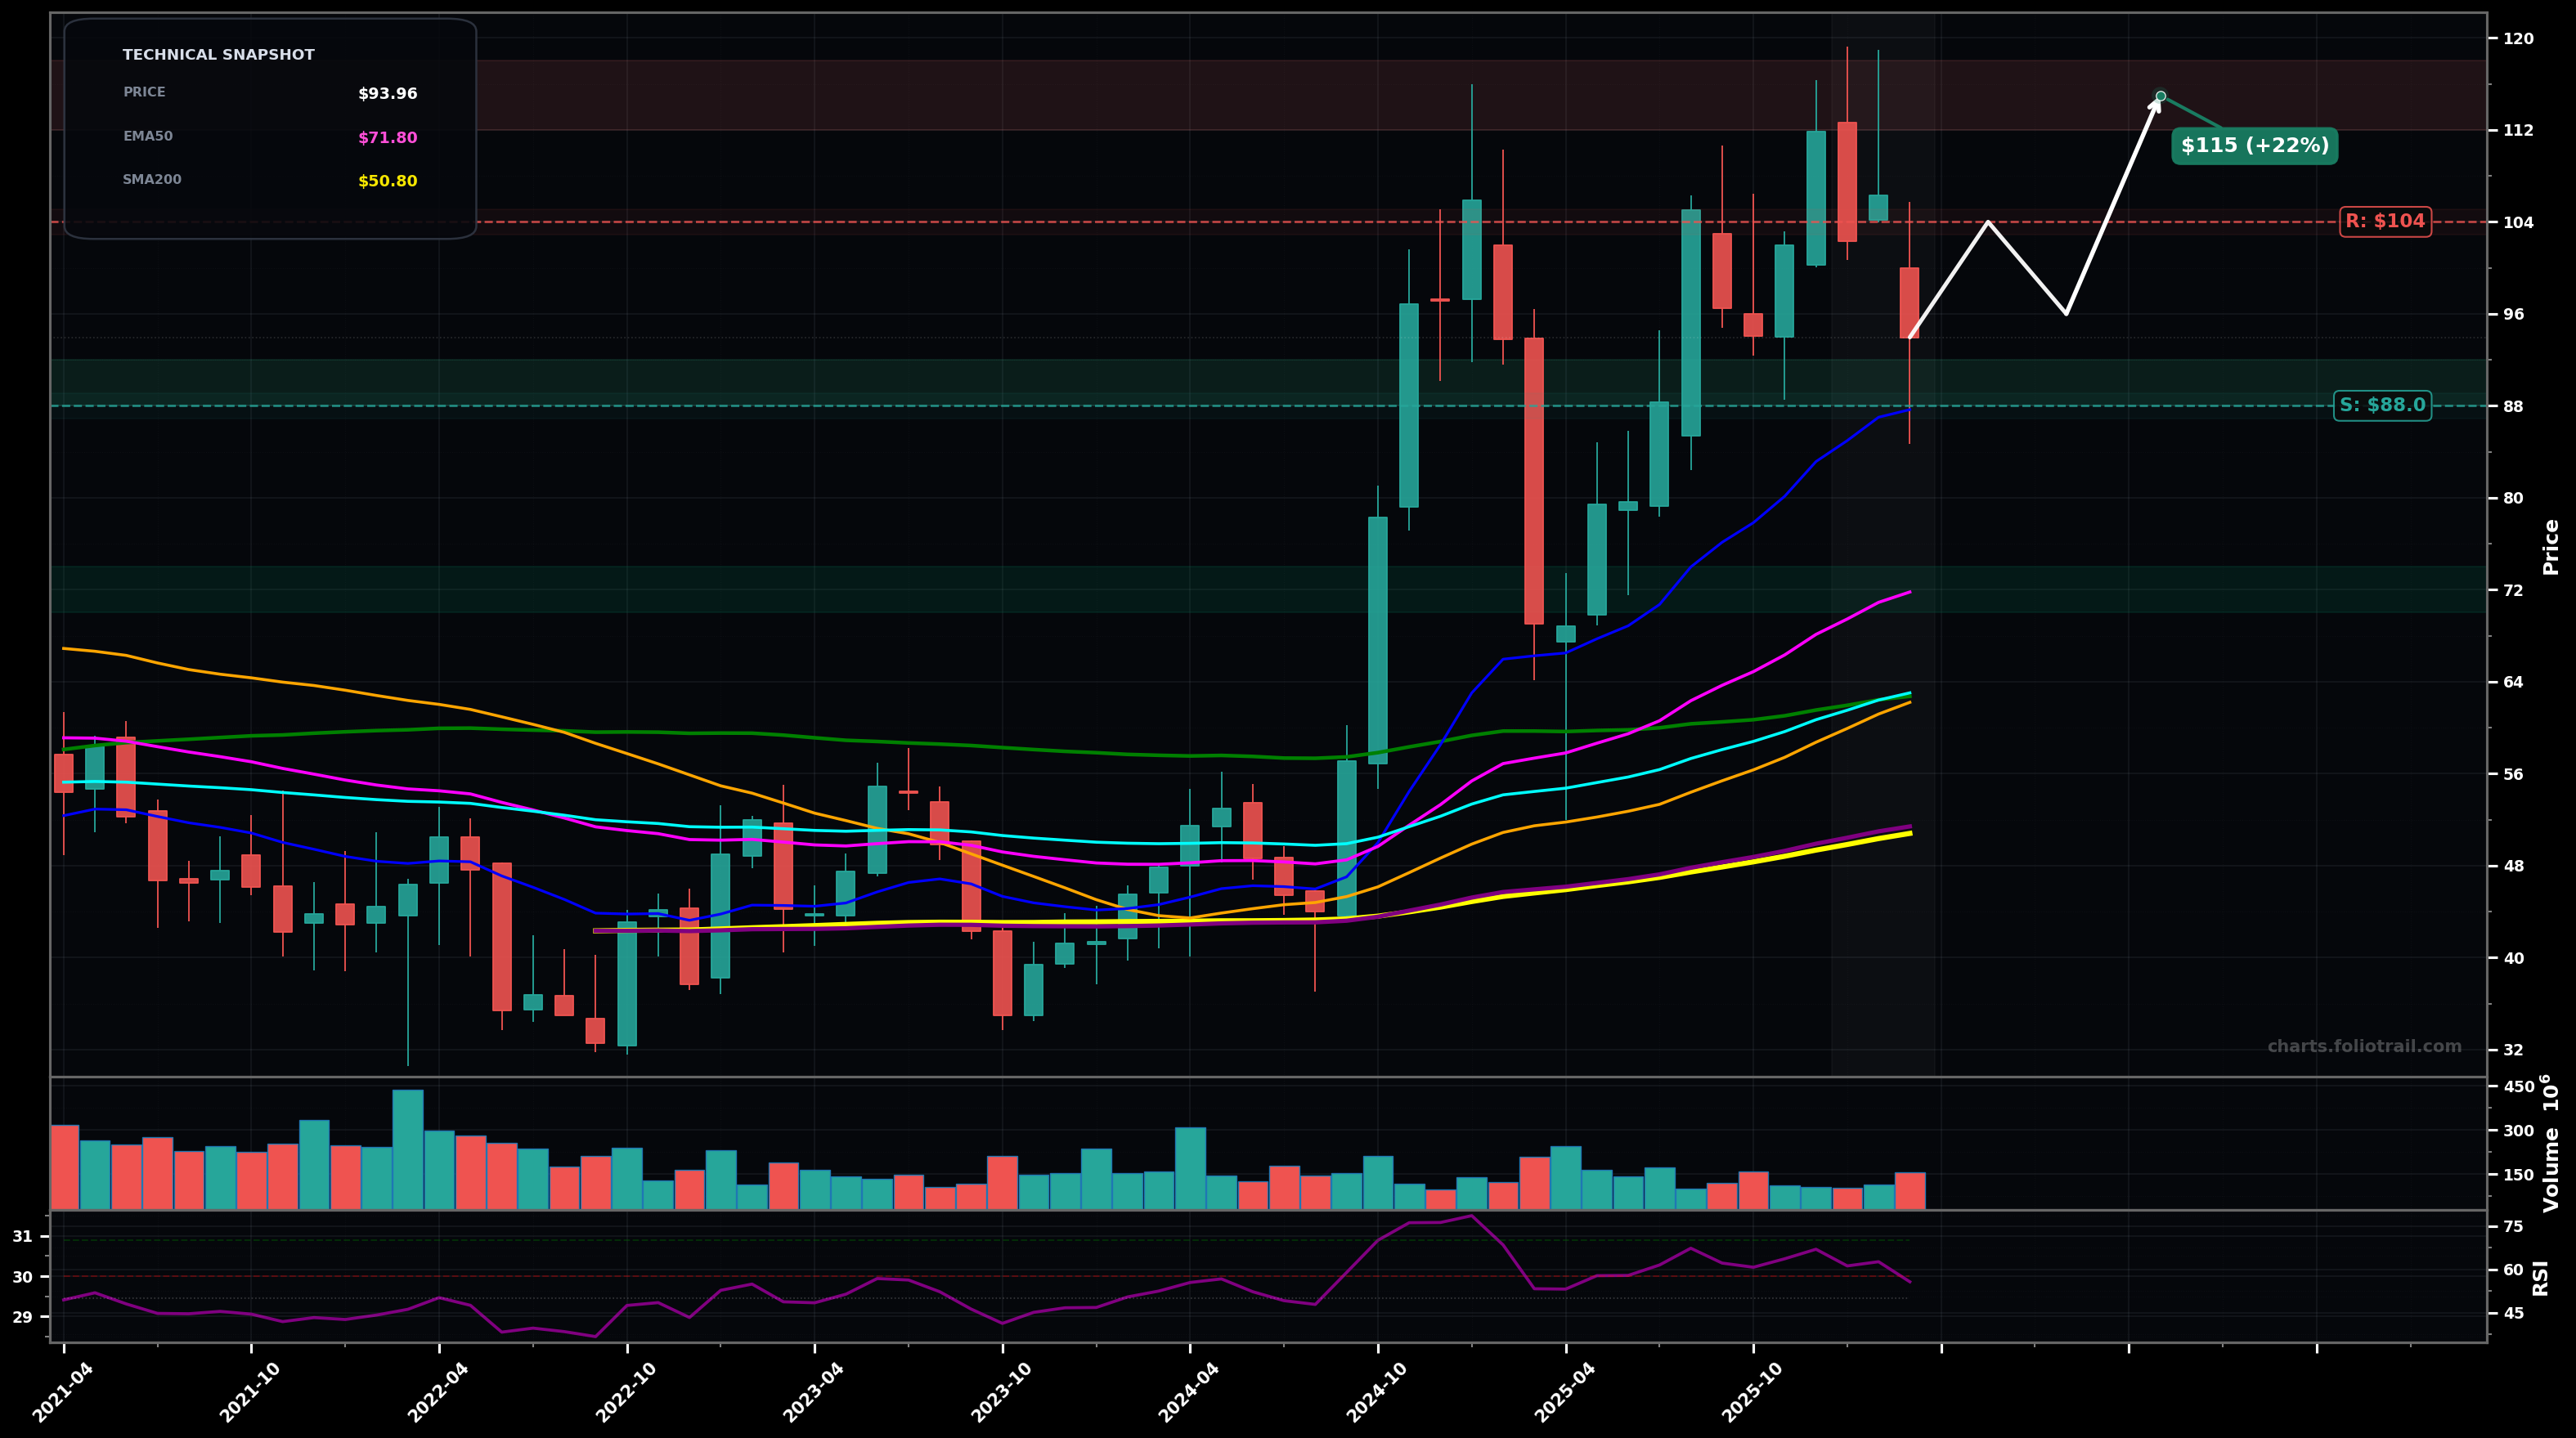
As of March 24, 2026, UAL (United Airlines Holdings Inc.) is in a uptrend state on the monthly chart, with a confidence level of 68%. Key support is at $88.0 and key resistance at $104. After a strong breakout/impulse above the long MAs, price pulled back from the $110-$115 area and is consolidating around $94 while still holding well above EMA50/EMA100.
Bullish continuation: this is likely a Wave 4-style consolidation after a strong Wave 3 impulse from the 2024 breakout; holding $88-$90 sets up a push back to the prior swing high area, then an extension.
Deeper pullback/mean reversion: a break below $88 turns the current pullback into a larger corrective A-B-C, with price gravitating toward the rising EMA50 region and prior breakout zone (Fib 0.382–0.50 of the $50→$115 move).
Monthly close back above $104 would confirm trend continuation and increase odds of a push to prior highs.
Monthly close below $88 would weaken the HH/HL structure and raise risk of a deeper mean-reversion toward EMA50.
Start near the current swing-low support ($88-$92); add on breakdown/flush toward prior consolidation; heavy add aligns with EMA50 (~$71.8) + Fib 0.50 retrace zone of the 2024-25 impulse.
Trim into retests/new highs ($112-$118) where supply previously hit; heavier trims on extended Wave-5 style upside; close if price becomes extremely stretched versus EMA50/EMA100 with blow-off characteristics.
As of March 24, 2026, UAL (United Airlines Holdings Inc.) is in a uptrend state on the monthly chart with 68% confidence. After a strong breakout/impulse above the long MAs, price pulled back from the $110-$115 area and is consolidating around $94 while still holding well above EMA50/EMA100.
On the monthly timeframe, UAL has key support at $88.0 and key resistance at $104. The most likely scenario (bullish) targets $104 and $115, with a revert level at $96.0.
UAL (United Airlines Holdings Inc.) is currently classified as uptrend on the monthly chart, with 68% confidence. Confirmation requires: Monthly close back above $104 would confirm trend continuation and increase odds of a push to prior highs. This would be invalidated by: Monthly close below $88 would weaken the HH/HL structure and raise risk of a deeper mean-reversion toward EMA50.
The most likely scenario (bullish) targets $104 and $115, with a revert level at $96.0. The alternative scenario (bearish) targets $80.0 and $72.0.
All content on this website — including charts, analysis, price targets, support/resistance levels, and position zones — is generated entirely by AI and provided for educational and informational purposes only.
This is not financial advice. NEXUSNOIR VENTURES SL (the operator of this website) is not a registered investment adviser or broker-dealer. You should not make investment decisions based solely on this information. Always do your own research and consult a qualified financial advisor.
By continuing, you acknowledge that you have read and agree to our full disclaimer & terms of use and privacy policy.