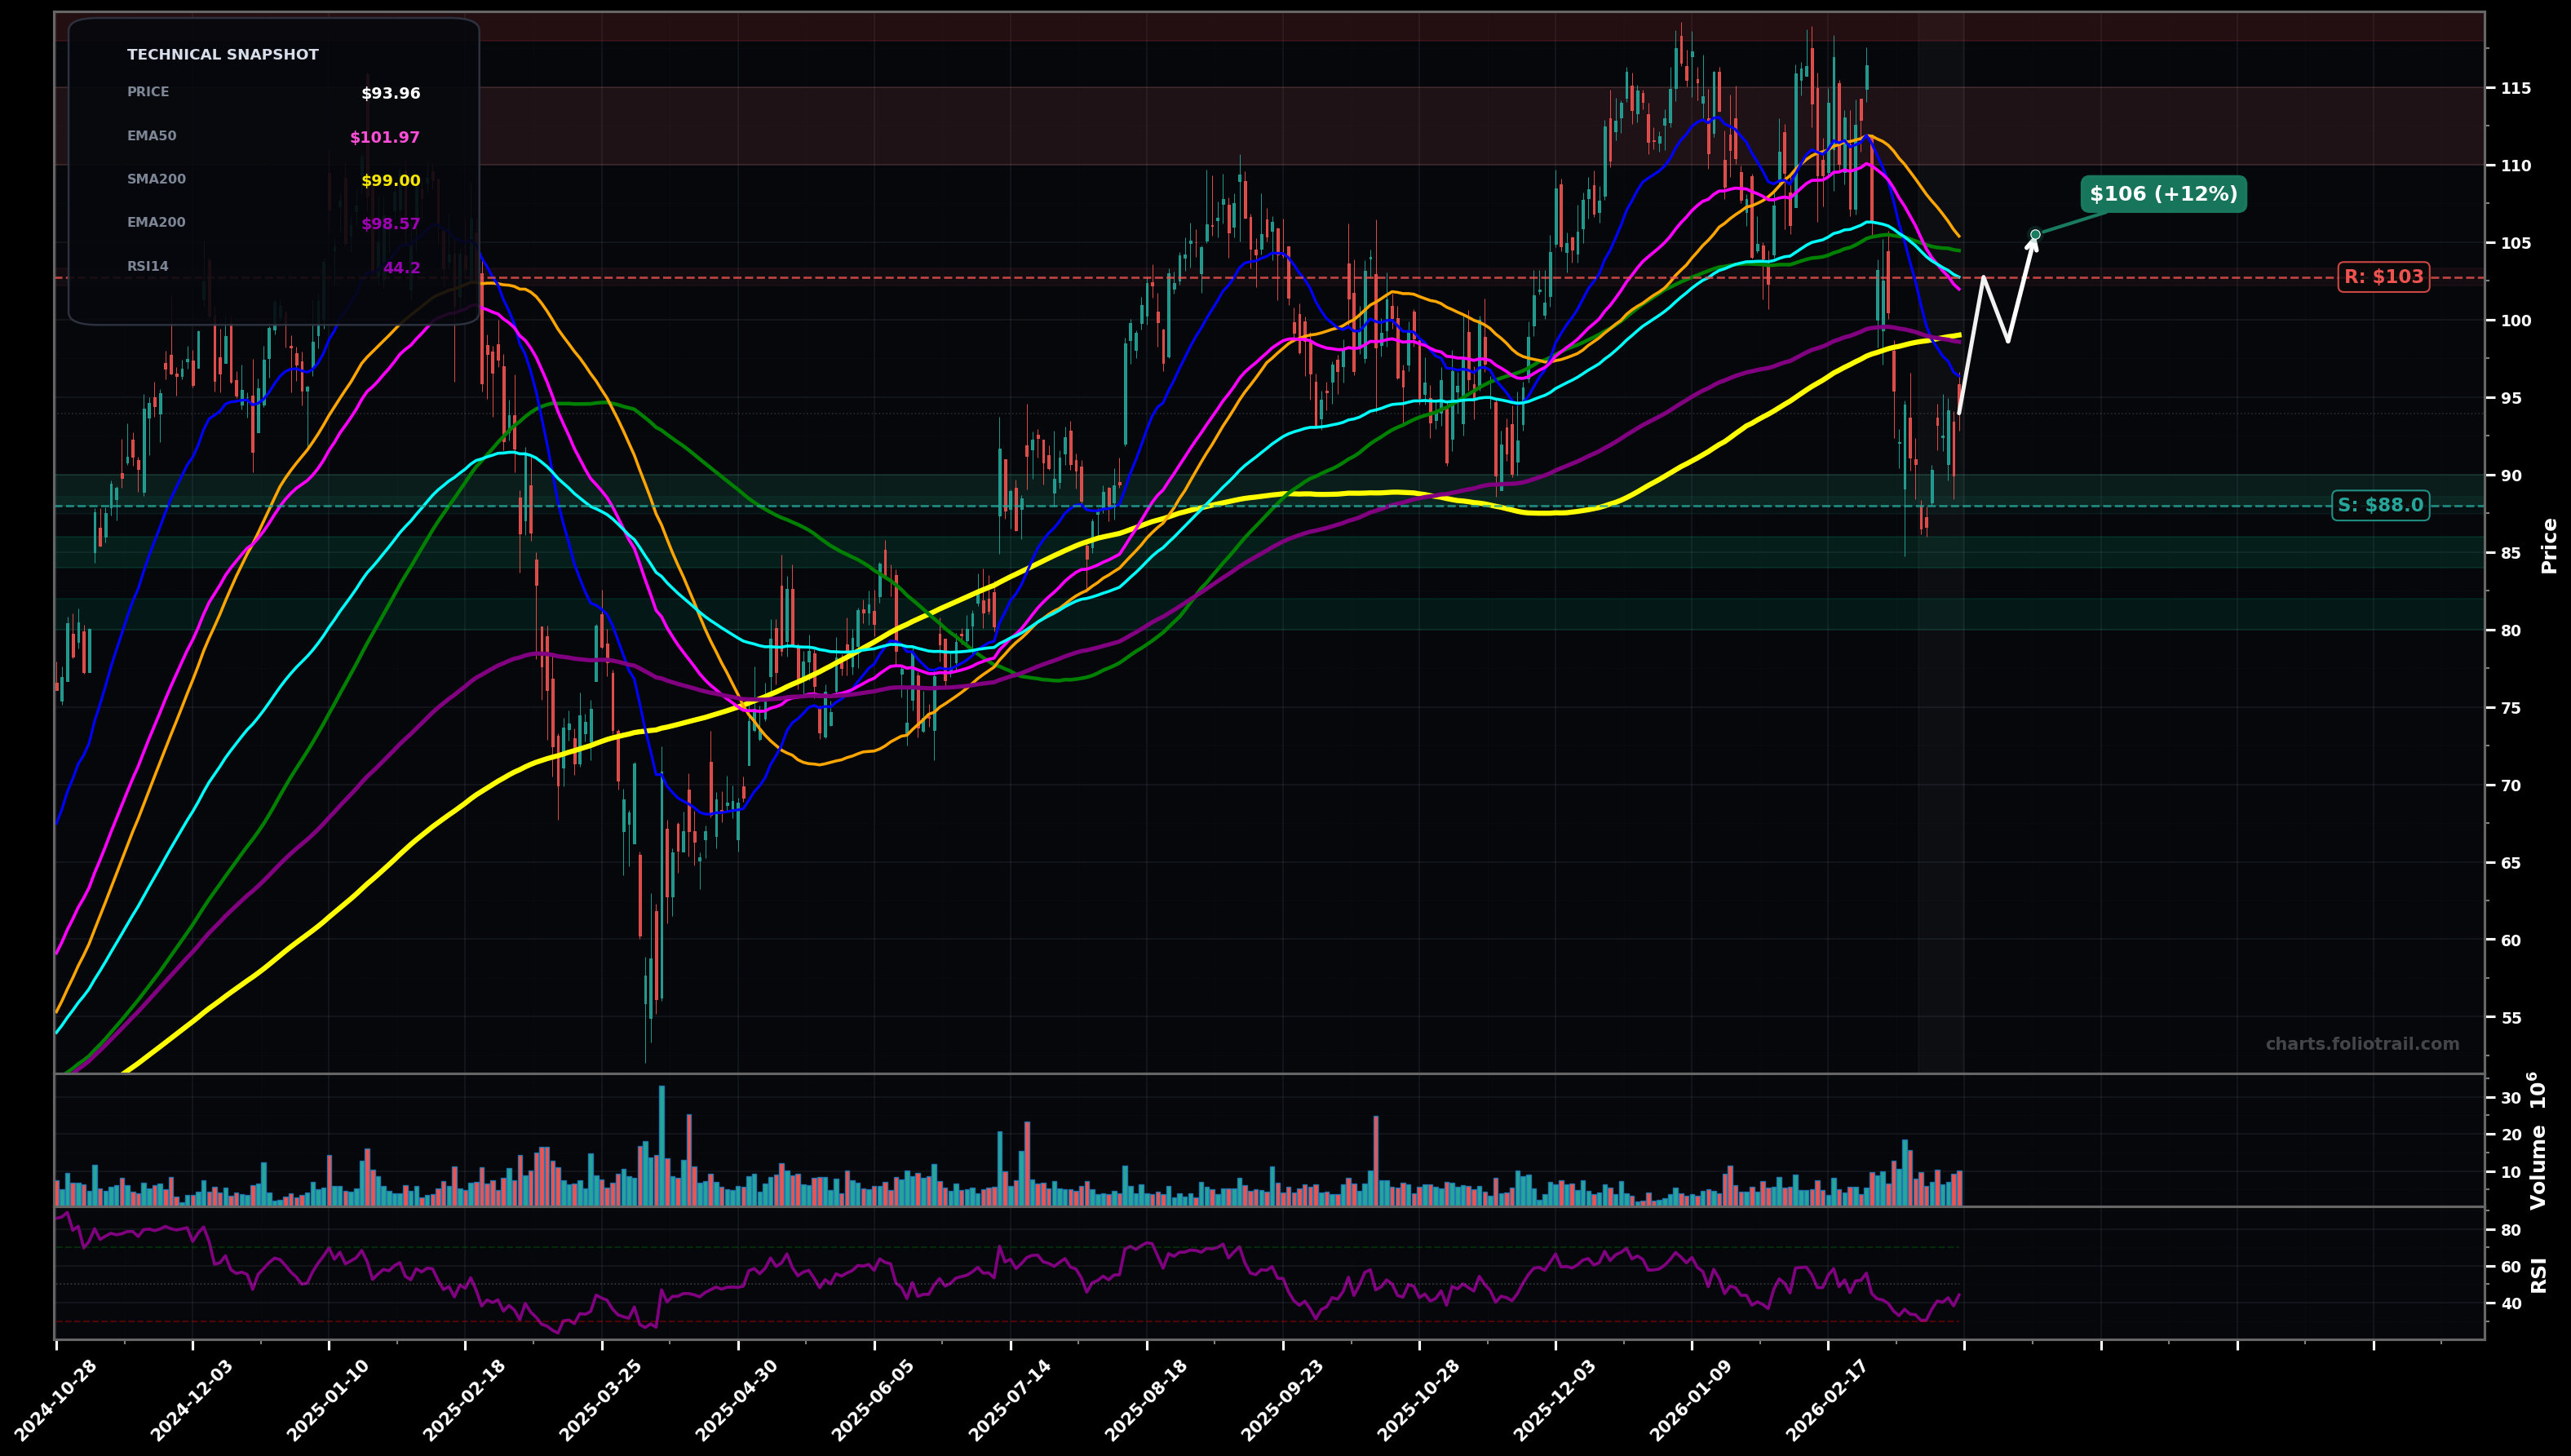
As of March 24, 2026, UAL (United Airlines Holdings Inc.) is in a bottoming attempt state on the daily chart, with a confidence level of 62%. Key support is at $88.0 and key resistance at $103. Sharp selloff from the $115–$118 area broke below the $99–$100 MA cluster (SMA200/EMA200) and price is now attempting a bounce but remains under declining EMA50/EMA100.
Base-building then mean-reversion bounce: price holds $88–$90, grinds up to reclaim the EMA50/EMA100 zone, then retests the breakdown shelf near $105–$106 (SMA50) before deciding trend.
Bear continuation: bounce fails under $100–$103, sellers defend the EMA50/EMA100 cluster, and price rolls over to retest the March swing-low area, with risk of a deeper flush if $88 breaks.
Daily close back above $102.75 (EMA100) and hold it for 2+ closes
Daily close below $88.00 (break of the recent swing-low zone)
Buying interest is favored near the recent swing-low support ($88–$90); add more on a deeper Fibonacci-style retrace toward prior demand ($84–$86); heavy add only if capitulation tags the next major support pocket ($80–$82).
Trim into the prior distribution highs ($110–$115) and prior peak/extension zone ($118–$125); close if price reaches a new multi-year extension well above long MAs (likely late-cycle Elliott Wave 5 style stretch).
As of March 24, 2026, UAL (United Airlines Holdings Inc.) is in a bottoming attempt state on the daily chart with 62% confidence. Sharp selloff from the $115–$118 area broke below the $99–$100 MA cluster (SMA200/EMA200) and price is now attempting a bounce but remains under declining EMA50/EMA100.
On the daily timeframe, UAL has key support at $88.0 and key resistance at $103. The most likely scenario (bullish) targets $103 and $106, with a revert level at $98.6.
UAL (United Airlines Holdings Inc.) is currently classified as bottoming attempt on the daily chart, with 62% confidence. Confirmation requires: Daily close back above $102.75 (EMA100) and hold it for 2+ closes This would be invalidated by: Daily close below $88.00 (break of the recent swing-low zone)
The most likely scenario (bullish) targets $103 and $106, with a revert level at $98.6. The alternative scenario (bearish) targets $90.0 and $82.0.
All content on this website — including charts, analysis, price targets, support/resistance levels, and position zones — is generated entirely by AI and provided for educational and informational purposes only.
This is not financial advice. NEXUSNOIR VENTURES SL (the operator of this website) is not a registered investment adviser or broker-dealer. You should not make investment decisions based solely on this information. Always do your own research and consult a qualified financial advisor.
By continuing, you acknowledge that you have read and agree to our full disclaimer & terms of use and privacy policy.