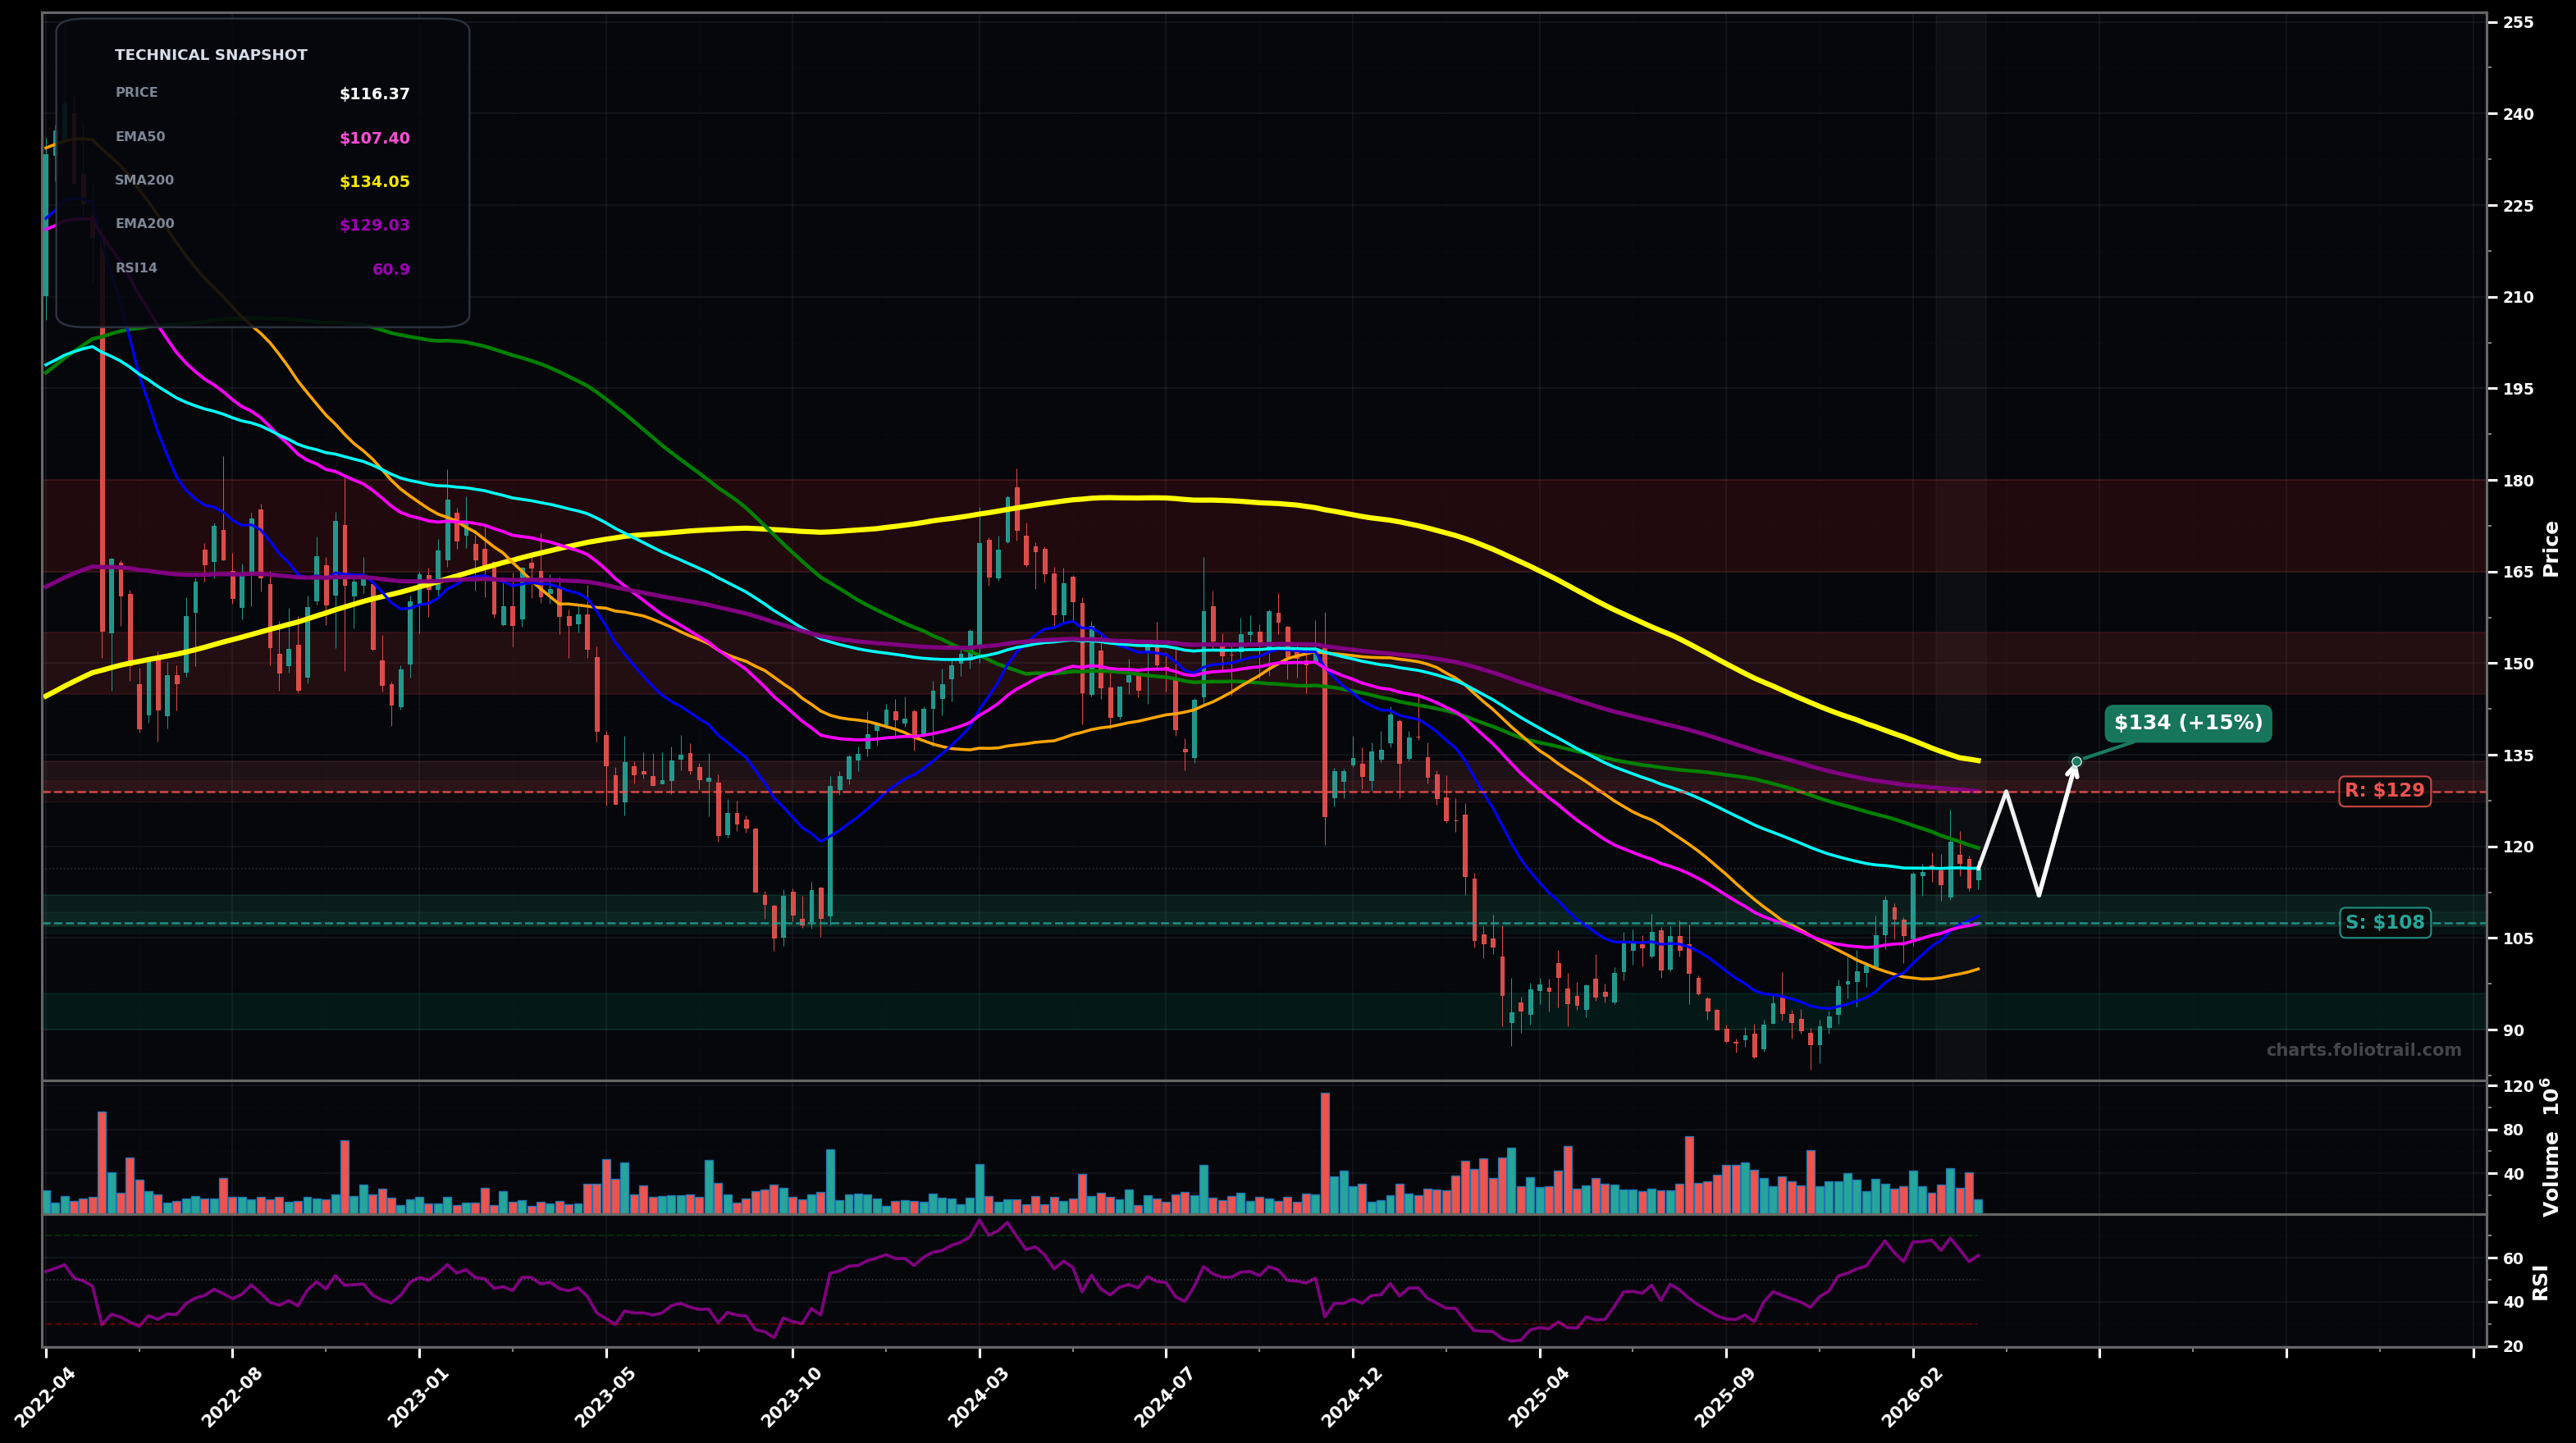
As of March 26, 2026, TGT (Target Corporation) is in a bottoming attempt state on the weekly chart, with a confidence level of 64%. Key support is at $108 and key resistance at $129. Weekly rebound from the ~$90 base pushed price to $116.37; now stalling just under EMA100 (cyan) ~$116.43 while still below declining EMA200 (purple) ~$129 and SMA200 (yellow) ~$134.
Base-to-reversal grind: pullback/hold above $107.5 then push through $129 and mean-revert toward the falling SMA200 area.
Failed breakout: rejection at $116-$129 leads to a retest of the prior breakout zone (EMA50) and possibly the base if sellers regain control.
2+ weekly closes above $129 (EMA200) would confirm a breakout/reversal attempt
Weekly close below $105 would invalidate the bottoming attempt and re-open downside risk
Buy-the-dip framework around reclaimed EMA50/structure ($107-$112), add on deeper mean reversion ($100-$107), heavy add only on base retest near the swing-low support ($90-$96).
Trim into major overhead supply: EMA200/SMA200 cluster ($129-$134), then next resistance band near prior distribution shelves ($145-$155), and fully close into upper prior-cycle resistance if reached ($165-$180).
As of March 26, 2026, TGT (Target Corporation) is in a bottoming attempt state on the weekly chart with 64% confidence. Weekly rebound from the ~$90 base pushed price to $116.37; now stalling just under EMA100 (cyan) ~$116.43 while still below declining EMA200 (purple) ~$129 and SMA200 (yellow) ~$134.
On the weekly timeframe, TGT has key support at $108 and key resistance at $129. The most likely scenario (bullish) targets $129 and $134, with a revert level at $112.
TGT (Target Corporation) is currently classified as bottoming attempt on the weekly chart, with 64% confidence. Confirmation requires: 2+ weekly closes above $129 (EMA200) would confirm a breakout/reversal attempt This would be invalidated by: Weekly close below $105 would invalidate the bottoming attempt and re-open downside risk
The most likely scenario (bullish) targets $129 and $134, with a revert level at $112. The alternative scenario (bearish) targets $108 and $95.0.
Multi-layer AI agents analyse 200+ stocks across daily, weekly, and monthly timeframes — producing market state classifications, price scenarios with targets, and position entry/exit levels. Updated every trading day after market close. No paywall. No sign-up required.
Built by Foliotrail.
All content on this website — including charts, analysis, price targets, support/resistance levels, and position zones — is generated entirely by AI and provided for educational and informational purposes only.
This is not financial advice. NEXUSNOIR VENTURES SL (the operator of this website) is not a registered investment adviser or broker-dealer. You should not make investment decisions based solely on this information. Always do your own research and consult a qualified financial advisor.
By continuing, you acknowledge that you have read and agree to our full disclaimer & terms of use and privacy policy.