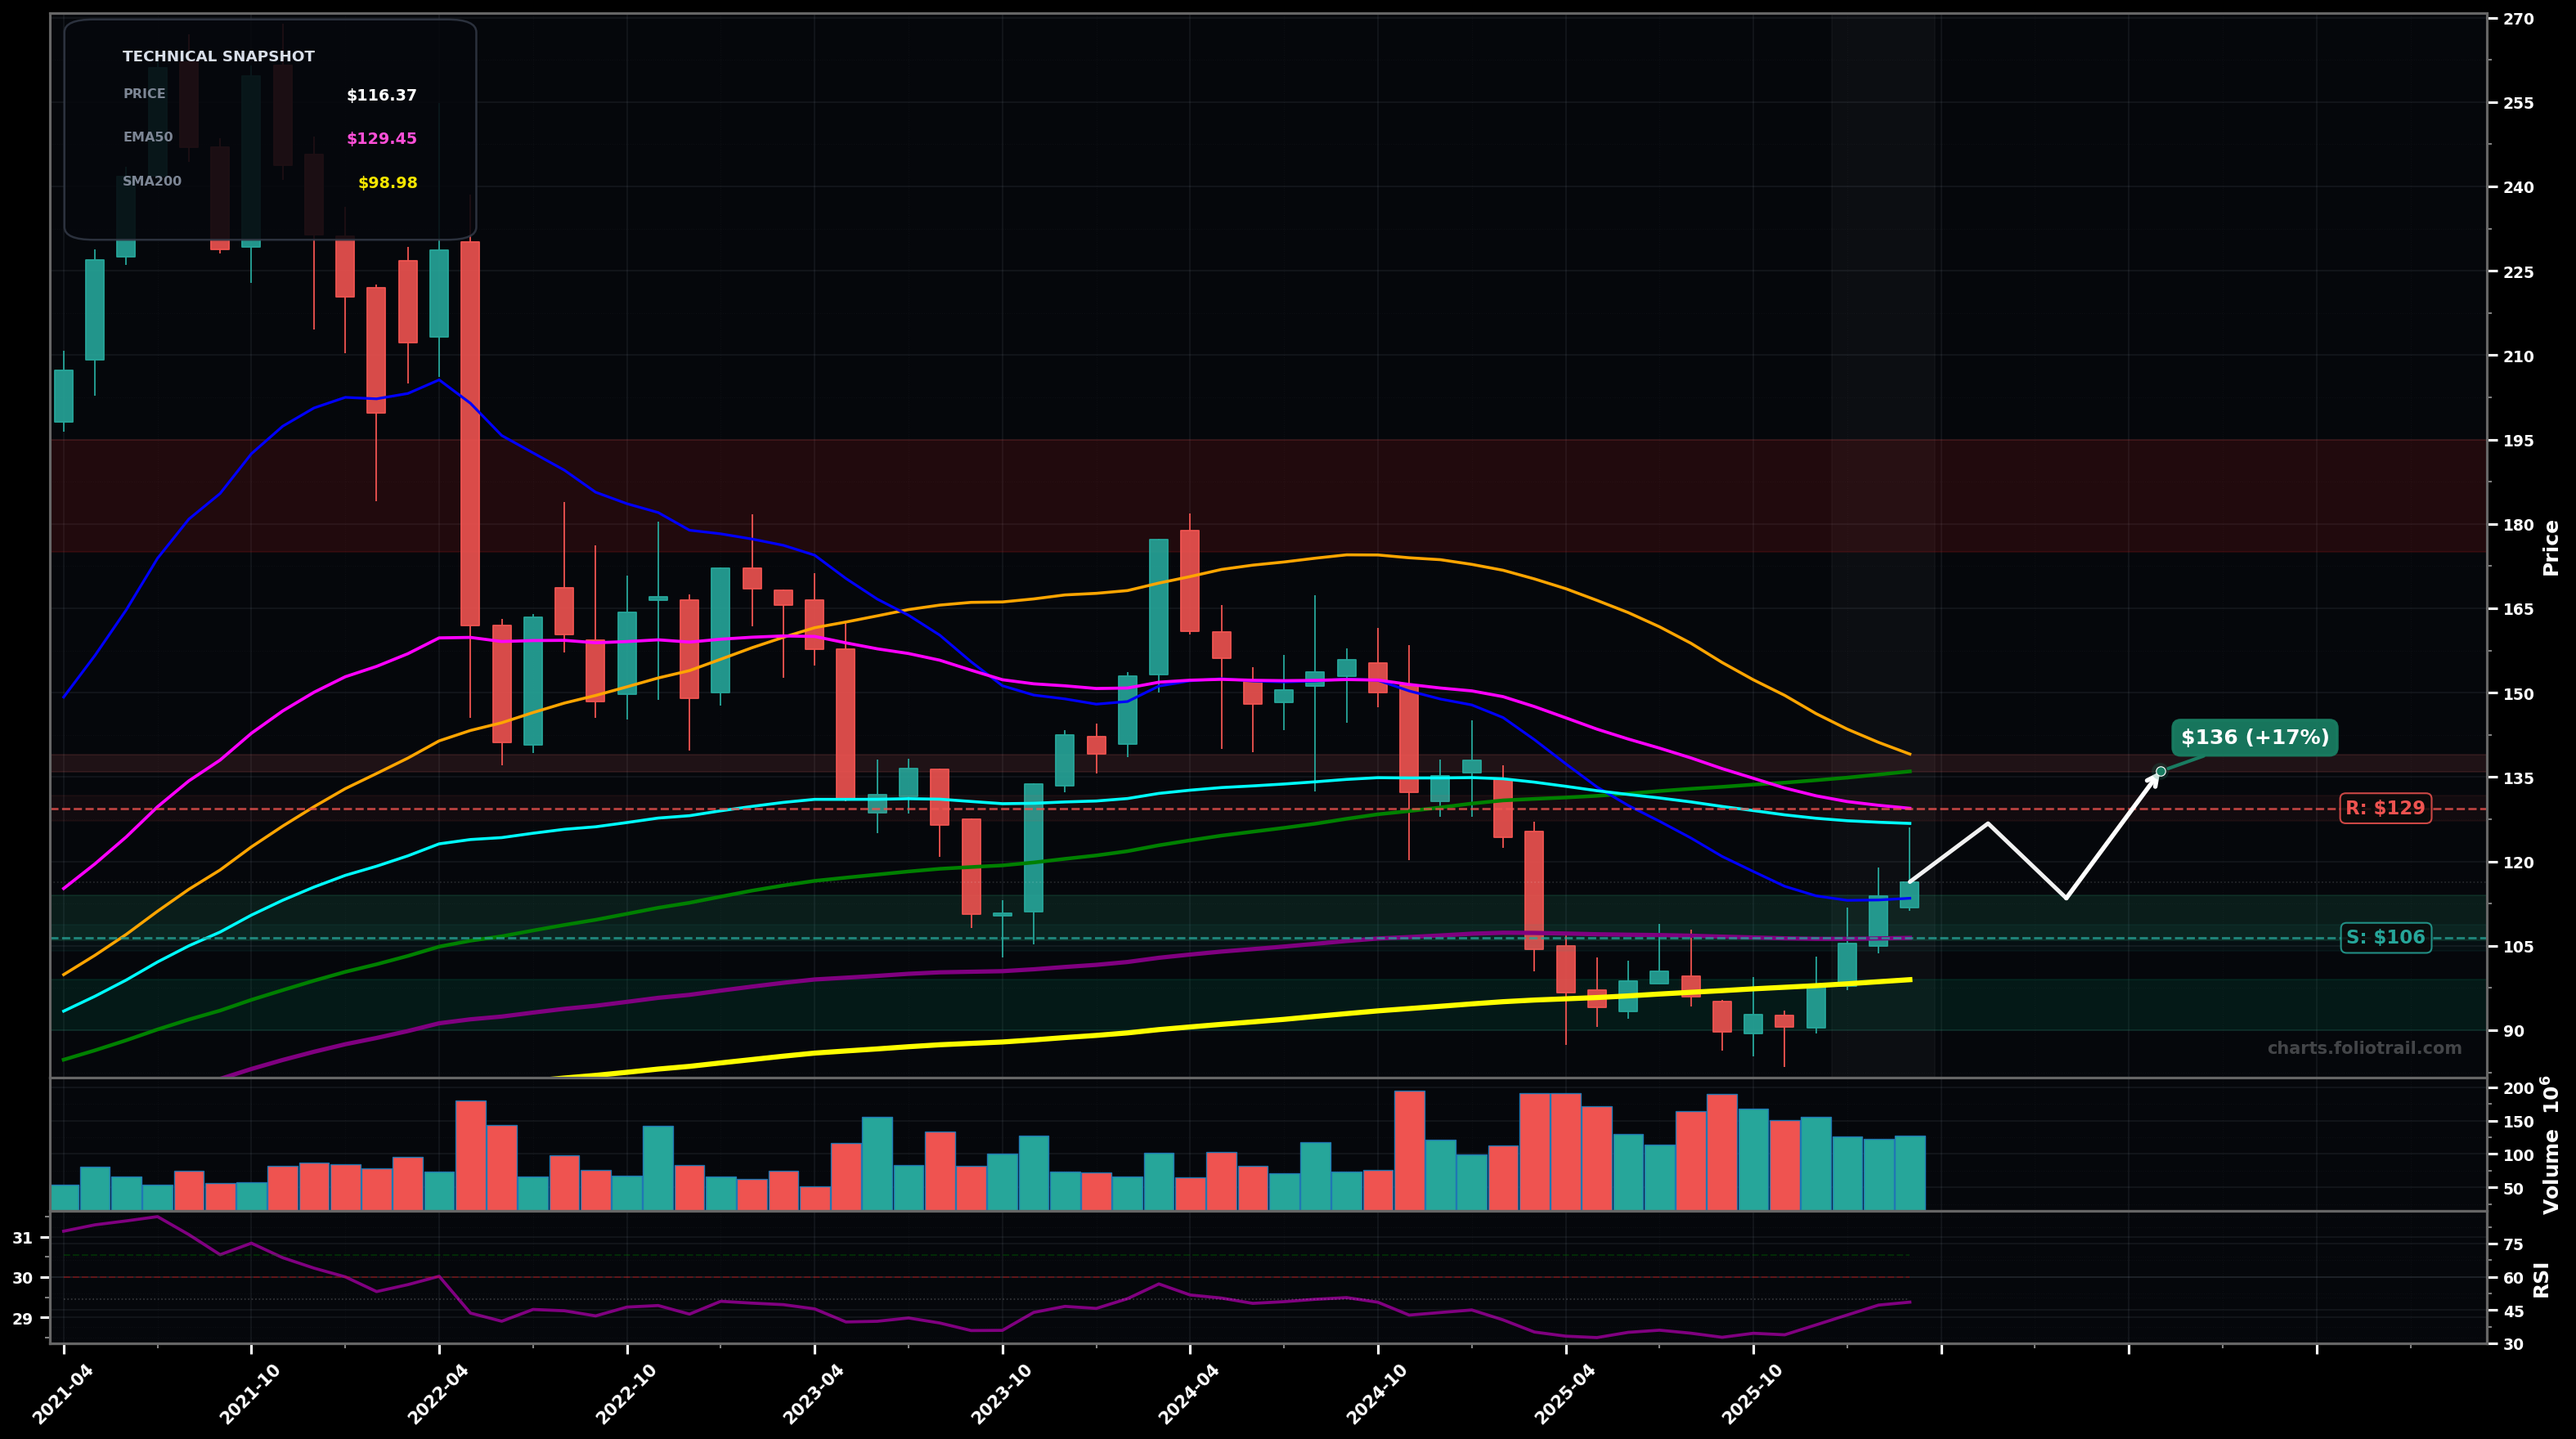
As of March 26, 2026, TGT (Target Corporation) is in a bottoming attempt state on the monthly chart, with a confidence level of 66%. Key support is at $106 and key resistance at $129. Monthly rebound off the ~$90–$100 base; price ~$116.37 is trying to reclaim the lower long-term averages while still under the declining medium-term MAs.
Base continues and price grinds higher, reclaiming EMA100 then testing the EMA50/SMA100 cluster; fits an Elliott Wave ABC-down completed with an early Wave 1 up (or Wave C bottom) now working through a Wave 2/accumulation then Wave 3/impulse if reclaim holds.
Rejection at EMA100/EMA50 zone and roll-over back into the base; could be a larger corrective Wave 2 failing, leading to another leg down (Wave 3 down) toward the prior swing-low area.
2+ monthly closes above ~$126 (EMA100/cyan ~$126.76 area) would confirm a reversal attempt
Monthly close back below ~$99 (SMA200/yellow ~$98.98) would invalidate the base/reversal thesis
Start near EMA200/SR flip (~$106–$114), add on deeper pullback into SMA200 (~$99–$106), heavy add only on retest/undercut of the base lows (~$90–$99).
Trim into the first major MA supply (SMA100/SMA50/EMA50 cluster ~$136–$139), heavier trims into prior breakdown zone (~$150–$165), and consider full exit into the bigger prior distribution/swing-high region (~$175–$195).
As of March 26, 2026, TGT (Target Corporation) is in a bottoming attempt state on the monthly chart with 66% confidence. Monthly rebound off the ~$90–$100 base; price ~$116.37 is trying to reclaim the lower long-term averages while still under the declining medium-term MAs.
On the monthly timeframe, TGT has key support at $106 and key resistance at $129. The most likely scenario (bullish) targets $127 and $136, with a revert level at $113.
TGT (Target Corporation) is currently classified as bottoming attempt on the monthly chart, with 66% confidence. Confirmation requires: 2+ monthly closes above ~$126 (EMA100/cyan ~$126.76 area) would confirm a reversal attempt This would be invalidated by: Monthly close back below ~$99 (SMA200/yellow ~$98.98) would invalidate the base/reversal thesis
The most likely scenario (bullish) targets $127 and $136, with a revert level at $113. The alternative scenario (bearish) targets $106 and $99.0.
Multi-layer AI agents analyse 200+ stocks across daily, weekly, and monthly timeframes — producing market state classifications, price scenarios with targets, and position entry/exit levels. Updated every trading day after market close. No paywall. No sign-up required.
Built by Foliotrail.
All content on this website — including charts, analysis, price targets, support/resistance levels, and position zones — is generated entirely by AI and provided for educational and informational purposes only.
This is not financial advice. NEXUSNOIR VENTURES SL (the operator of this website) is not a registered investment adviser or broker-dealer. You should not make investment decisions based solely on this information. Always do your own research and consult a qualified financial advisor.
By continuing, you acknowledge that you have read and agree to our full disclaimer & terms of use and privacy policy.