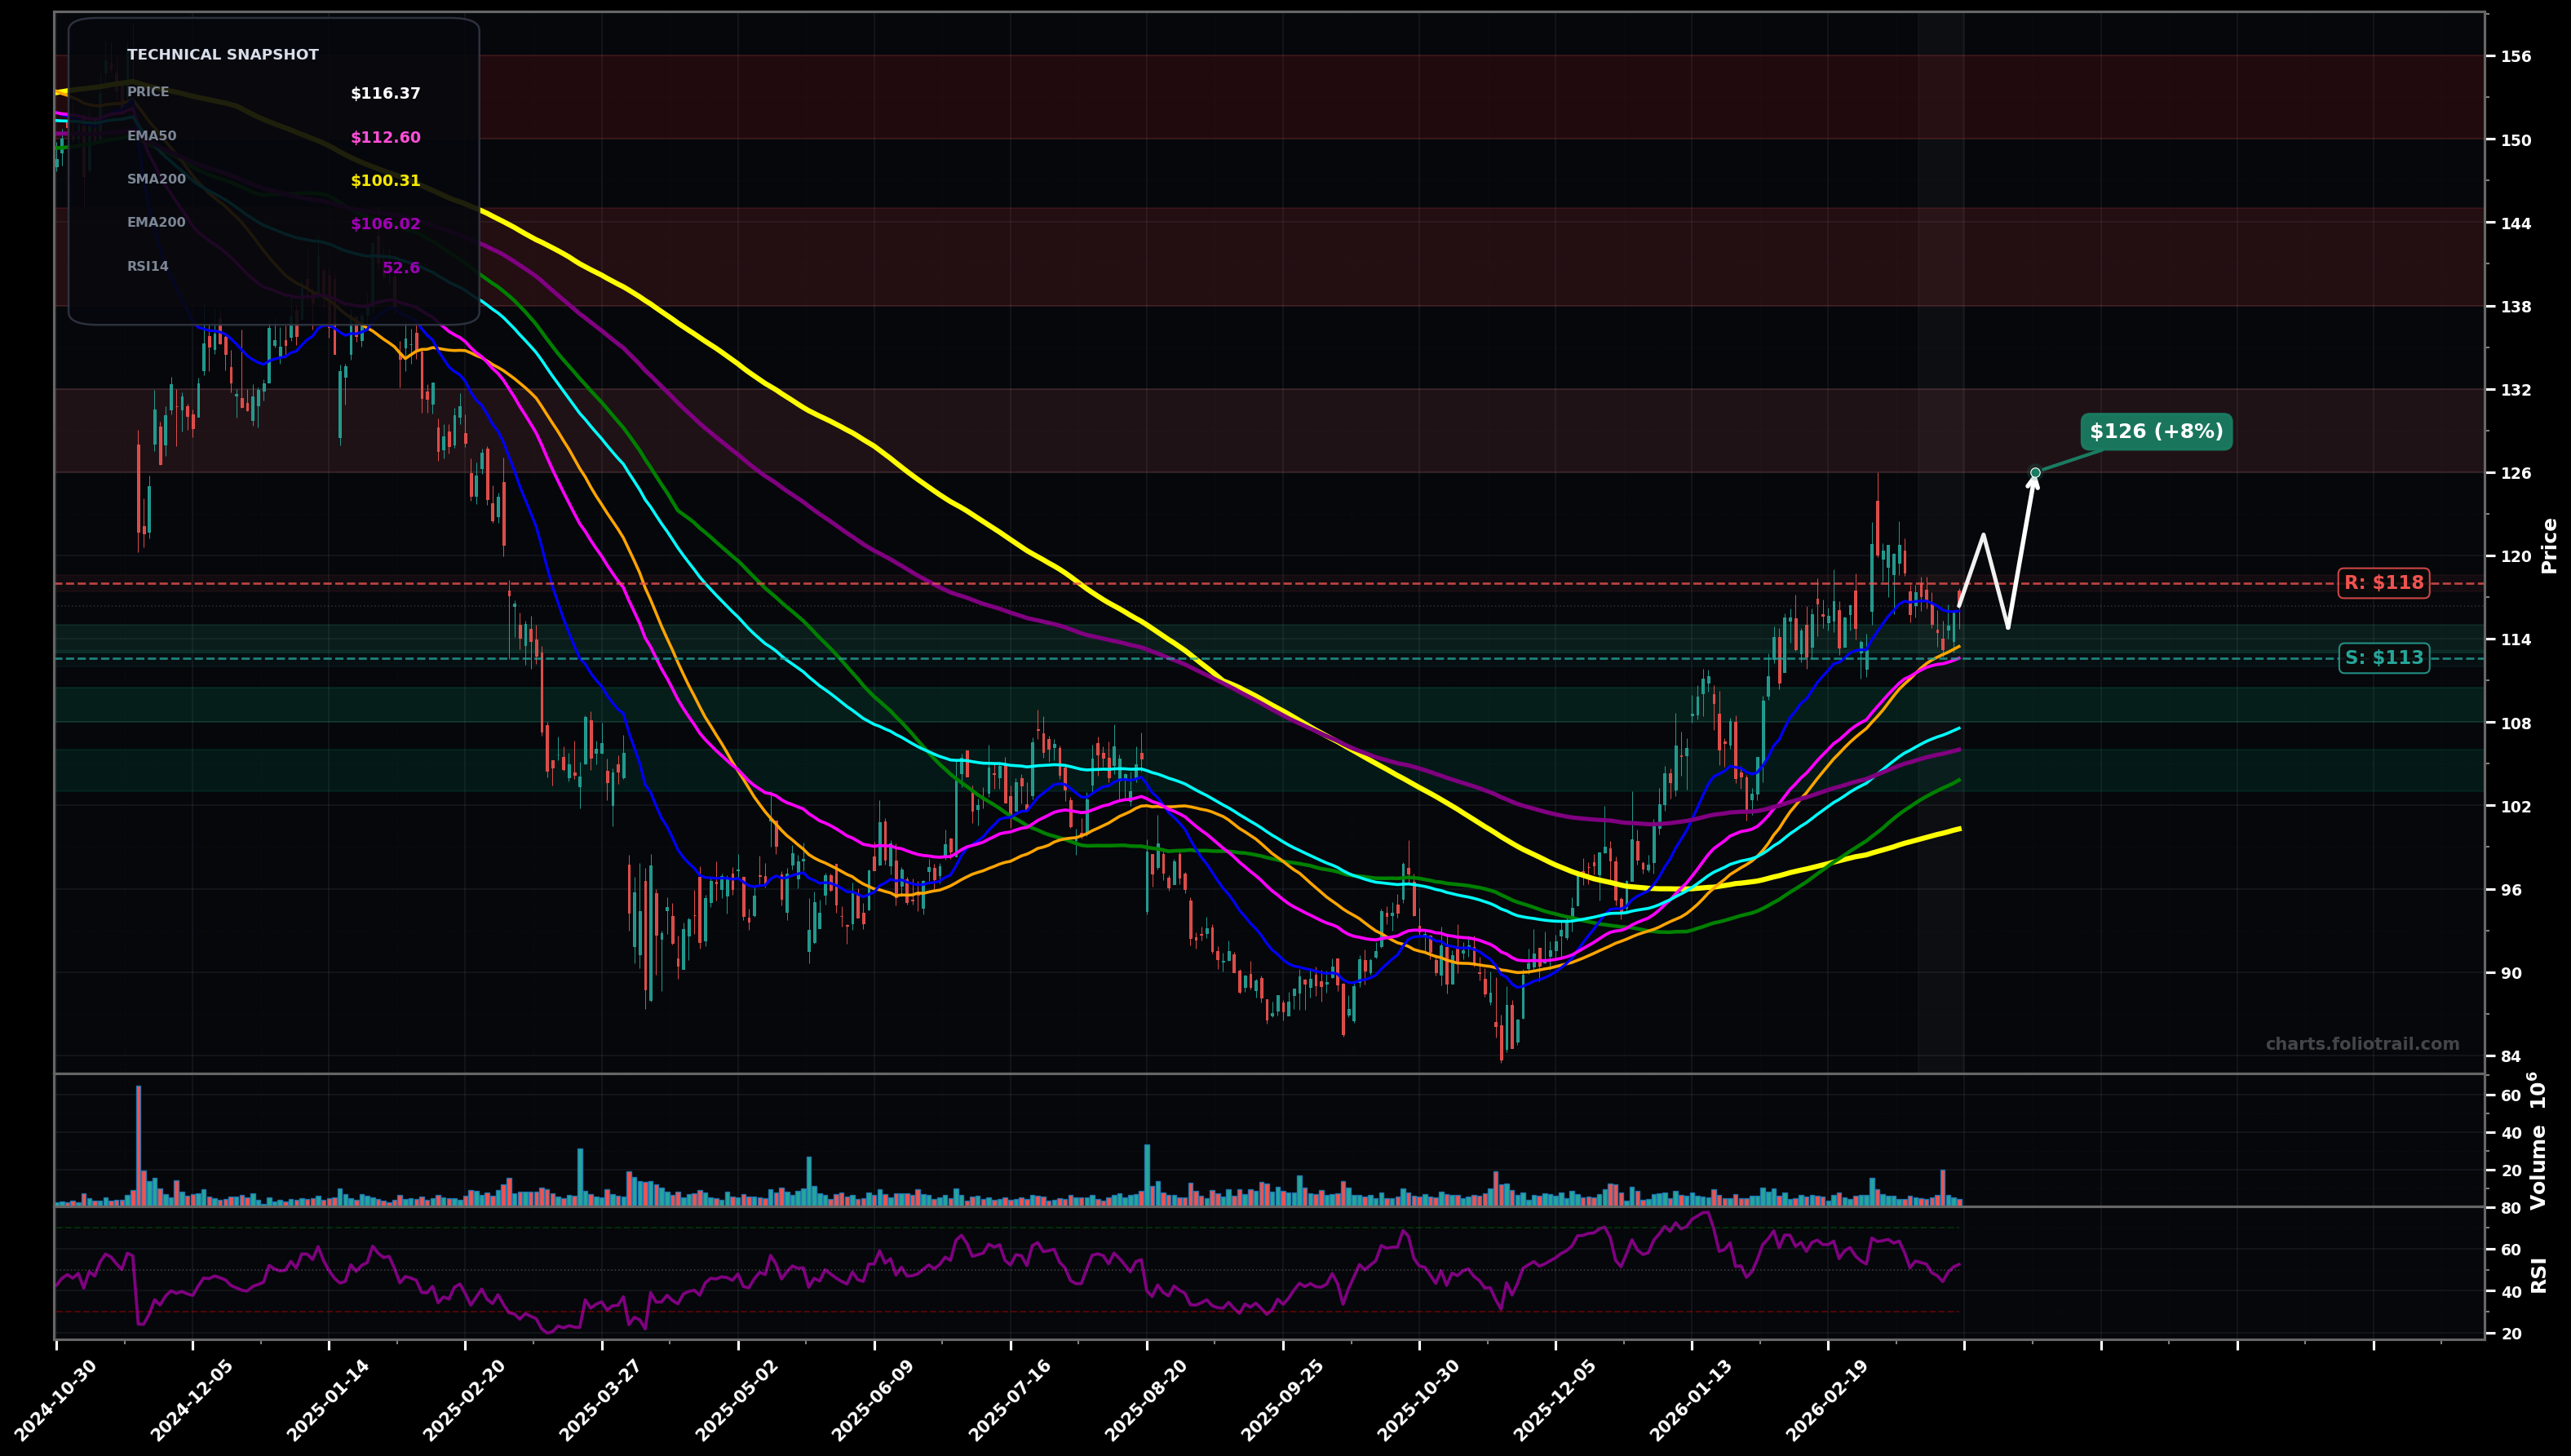
As of March 26, 2026, TGT (Target Corporation) is in a uptrend state on the daily chart, with a confidence level of 63%. Key support is at $113 and key resistance at $118. After a strong multi-month rally, price ($116.37) is pulling back/flagging just above the short MAs (SMA50 ~$115.45 / EMA20 ~$116) with RSI ~52 (cooling, not oversold).
Bullish continuation: consolidation resolves higher (bull flag); price holds above EMA50 then pushes back to the prior swing high and extends.
Deeper pullback: break below EMA50 triggers a larger ABC correction toward the medium-term MA cluster before buyers step back in.
2+ daily closes above $118.00 (reclaim/hold above the short-MA cluster and recent consolidation top).
Daily close below $112.50 (loss of EMA50 and last higher-low area).
Start near EMA50/prior breakout area; add on mean-reversion to EMA100; heavy add near SMA100 (~$103.83) + SMA200 (~$100.31) confluence and likely Wave-4/ABC termination zone.
Trim into extensions above the prior swing high as price becomes stretched vs EMA50/EMA100; heavier trims into prior supply zone/longer-term fib extension area, full exit if a parabolic extension develops into the mid-$150s.
As of March 26, 2026, TGT (Target Corporation) is in a uptrend state on the daily chart with 63% confidence. After a strong multi-month rally, price ($116.37) is pulling back/flagging just above the short MAs (SMA50 ~$115.45 / EMA20 ~$116) with RSI ~52 (cooling, not oversold).
On the daily timeframe, TGT has key support at $113 and key resistance at $118. The most likely scenario (bullish) targets $122 and $126, with a revert level at $115.
TGT (Target Corporation) is currently classified as uptrend on the daily chart, with 63% confidence. Confirmation requires: 2+ daily closes above $118.00 (reclaim/hold above the short-MA cluster and recent consolidation top). This would be invalidated by: Daily close below $112.50 (loss of EMA50 and last higher-low area).
The most likely scenario (bullish) targets $122 and $126, with a revert level at $115. The alternative scenario (bearish) targets $108 and $104.
Multi-layer AI agents analyse 200+ stocks across daily, weekly, and monthly timeframes — producing market state classifications, price scenarios with targets, and position entry/exit levels. Updated every trading day after market close. No paywall. No sign-up required.
Built by Foliotrail.
All content on this website — including charts, analysis, price targets, support/resistance levels, and position zones — is generated entirely by AI and provided for educational and informational purposes only.
This is not financial advice. NEXUSNOIR VENTURES SL (the operator of this website) is not a registered investment adviser or broker-dealer. You should not make investment decisions based solely on this information. Always do your own research and consult a qualified financial advisor.
By continuing, you acknowledge that you have read and agree to our full disclaimer & terms of use and privacy policy.