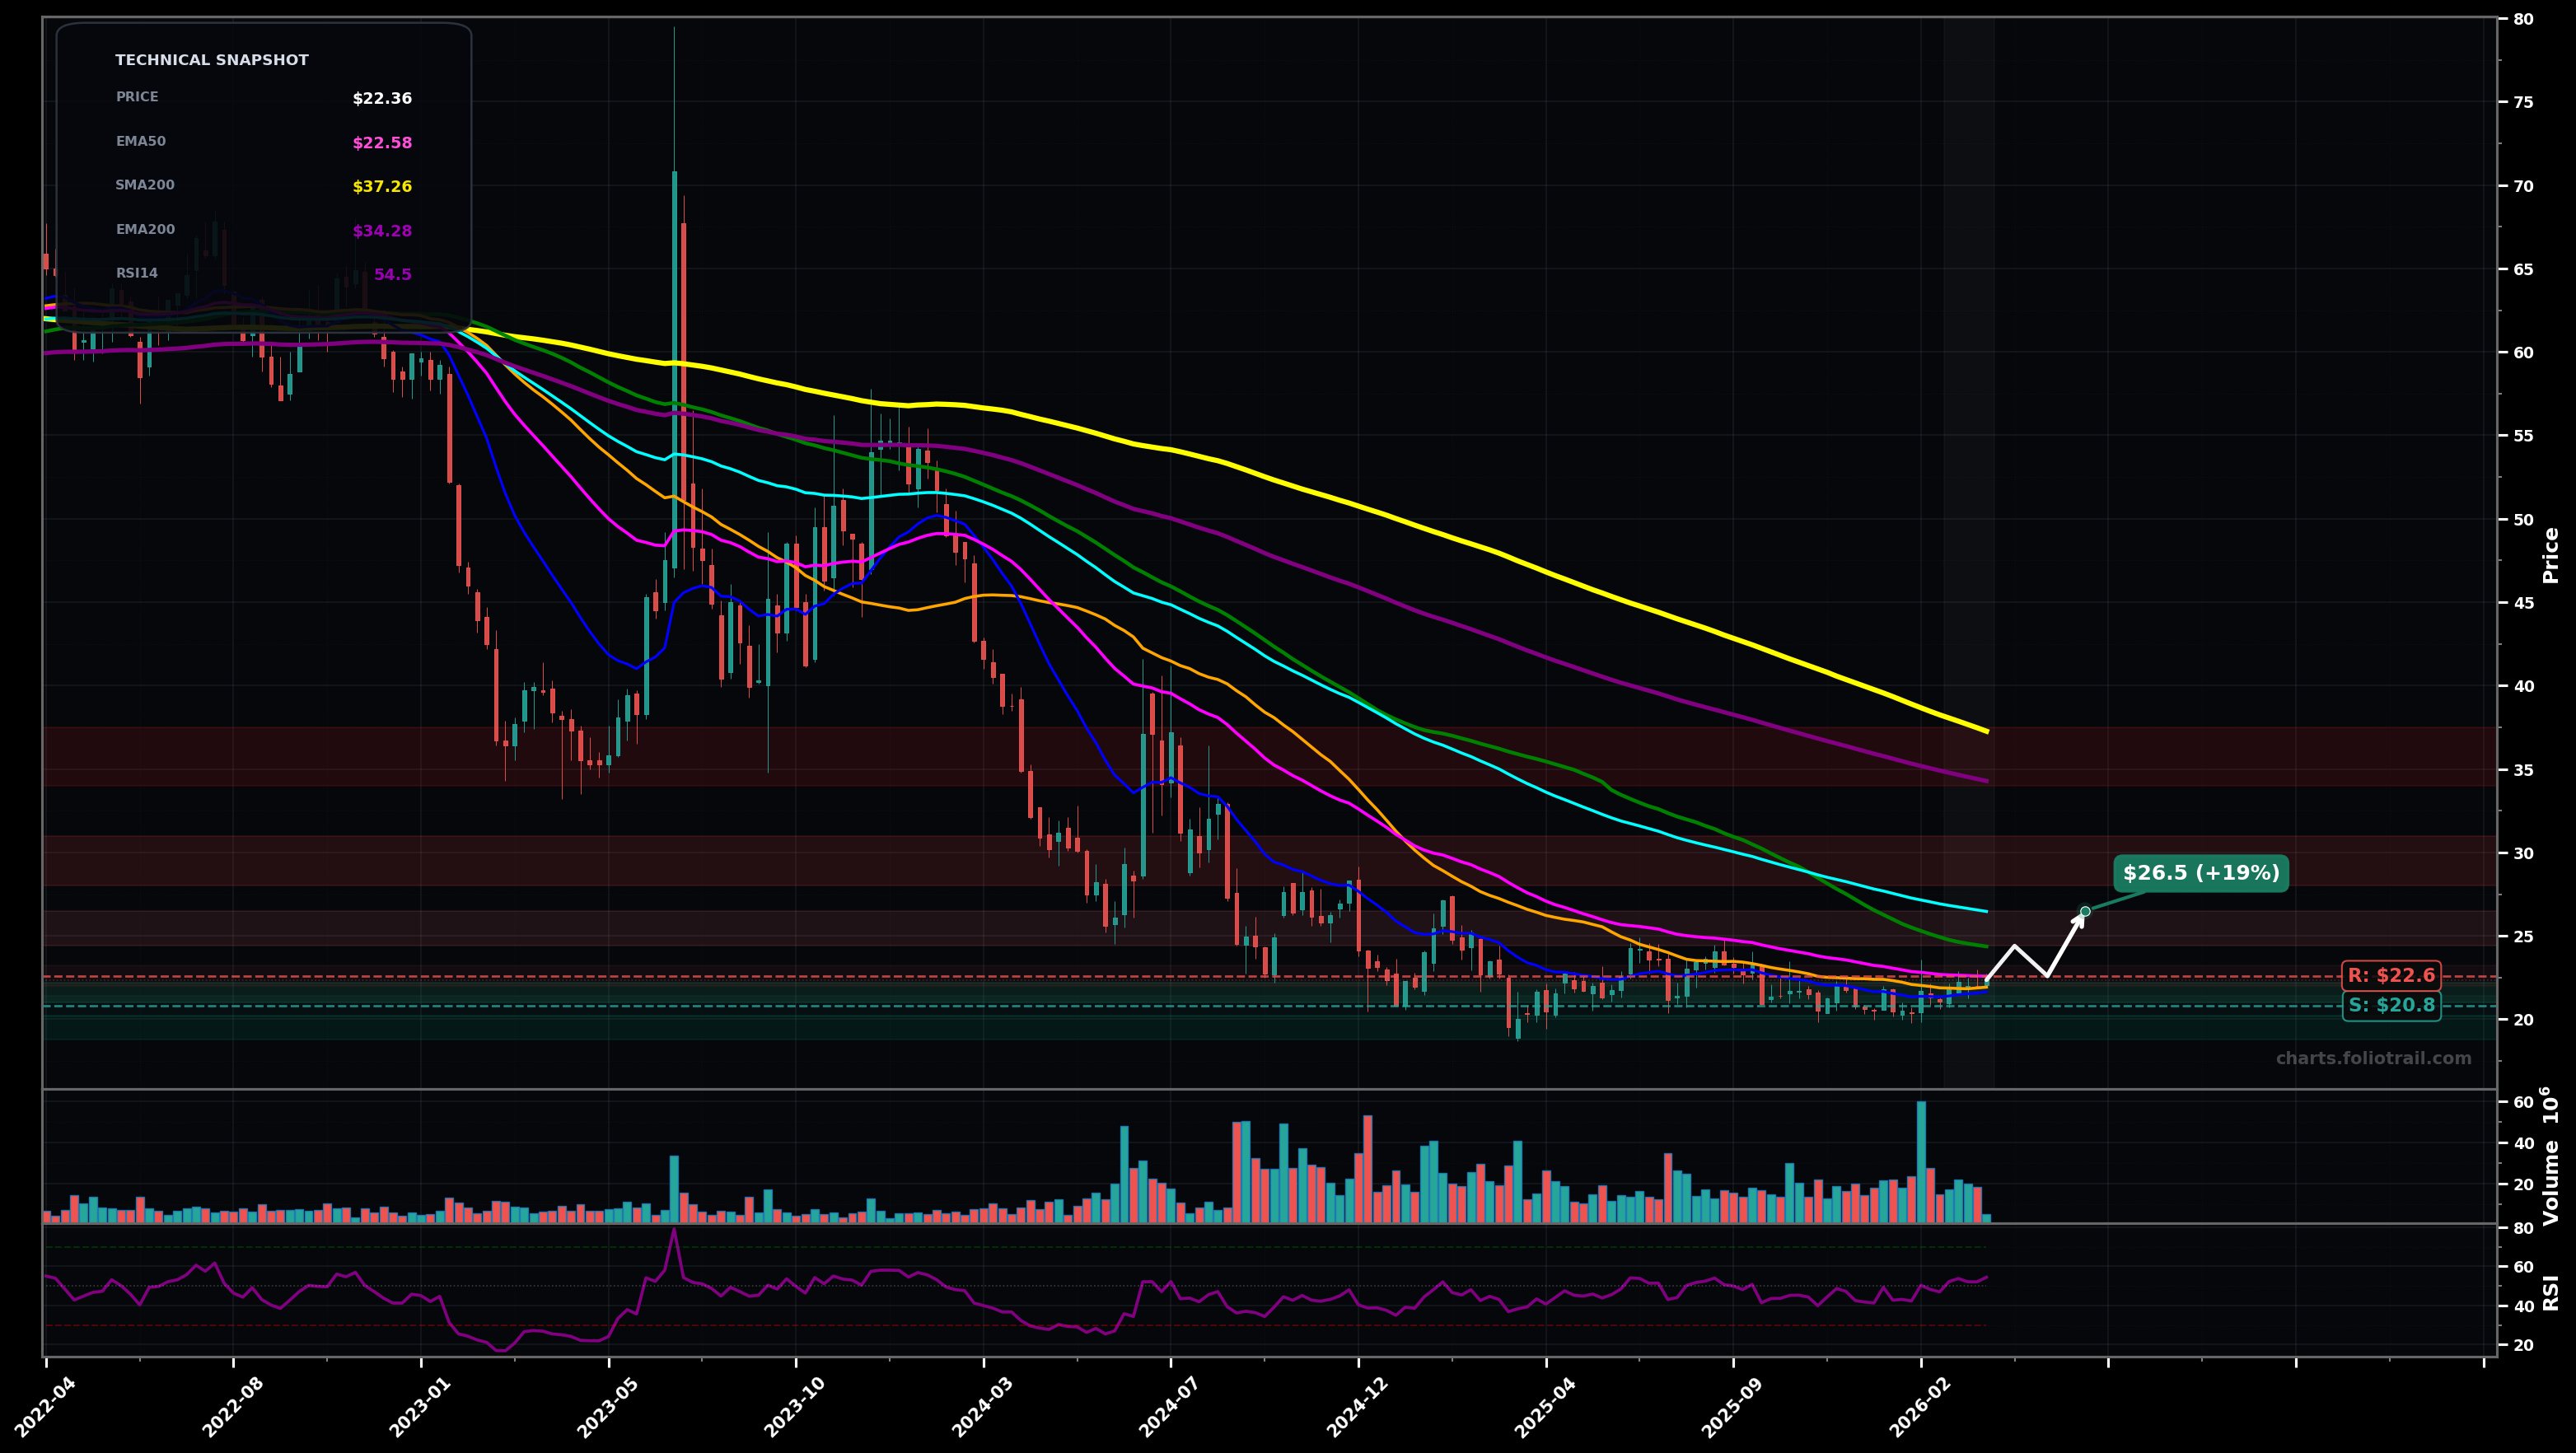
As of March 25, 2026, SIRI (Sirius XM Holdings Inc.) is in a stabilized base state on the weekly chart, with a confidence level of 63%. Key support is at $20.8 and key resistance at $22.6. Weekly price is basing around $21–$23; small bounce with RSI ~54, but still under the declining EMA50/EMA100 cluster and well below the long-term SMA200.
Base continues with a mild bullish bias: price reclaims EMA50 and grinds toward the first heavy MA cluster (SMA100/EMA100), then pauses for a pullback/retest before attempting the next leg up.
Failed reclaim: rejection at EMA50/near-term resistance leads to a rollover back into the base, with an undercut of support (liquidity sweep) and potential continuation lower if the floor breaks.
2+ weekly closes above $22.60 (EMA50) with a follow-through push toward $24.40 (SMA100).
Weekly close below $20.80 (range floor / recent swing-low reference) would shift back toward DOWNTREND risk.
Start near the middle/lower band of the base, add on support tests, heavy-add only on a deeper flush toward the next demand zone if $20.80 is lost intrabar but stabilizes.
Trim into the overhead MA supply zones first (SMA100/EMA100 then EMA200), and consider full exit into the long-term mean reversion area near the SMA200 (~$37) where prior downtrend supply is likely strongest.
As of March 25, 2026, SIRI (Sirius XM Holdings Inc.) is in a stabilized base state on the weekly chart with 63% confidence. Weekly price is basing around $21–$23; small bounce with RSI ~54, but still under the declining EMA50/EMA100 cluster and well below the long-term SMA200.
On the weekly timeframe, SIRI has key support at $20.8 and key resistance at $22.6. The most likely scenario (bullish) targets $24.4 and $26.5, with a revert level at $22.6.
SIRI (Sirius XM Holdings Inc.) is currently classified as stabilized base on the weekly chart, with 63% confidence. Confirmation requires: 2+ weekly closes above $22.60 (EMA50) with a follow-through push toward $24.40 (SMA100). This would be invalidated by: Weekly close below $20.80 (range floor / recent swing-low reference) would shift back toward DOWNTREND risk.
The most likely scenario (bullish) targets $24.4 and $26.5, with a revert level at $22.6. The alternative scenario (bearish) targets $20.8 and $19.0.
Multi-layer AI agents analyse 200+ stocks across daily, weekly, and monthly timeframes — producing market state classifications, price scenarios with targets, and position entry/exit levels. Updated every trading day after market close. No paywall. No sign-up required.
Built by Foliotrail.
All content on this website — including charts, analysis, price targets, support/resistance levels, and position zones — is generated entirely by AI and provided for educational and informational purposes only.
This is not financial advice. NEXUSNOIR VENTURES SL (the operator of this website) is not a registered investment adviser or broker-dealer. You should not make investment decisions based solely on this information. Always do your own research and consult a qualified financial advisor.
By continuing, you acknowledge that you have read and agree to our full disclaimer & terms of use and privacy policy.