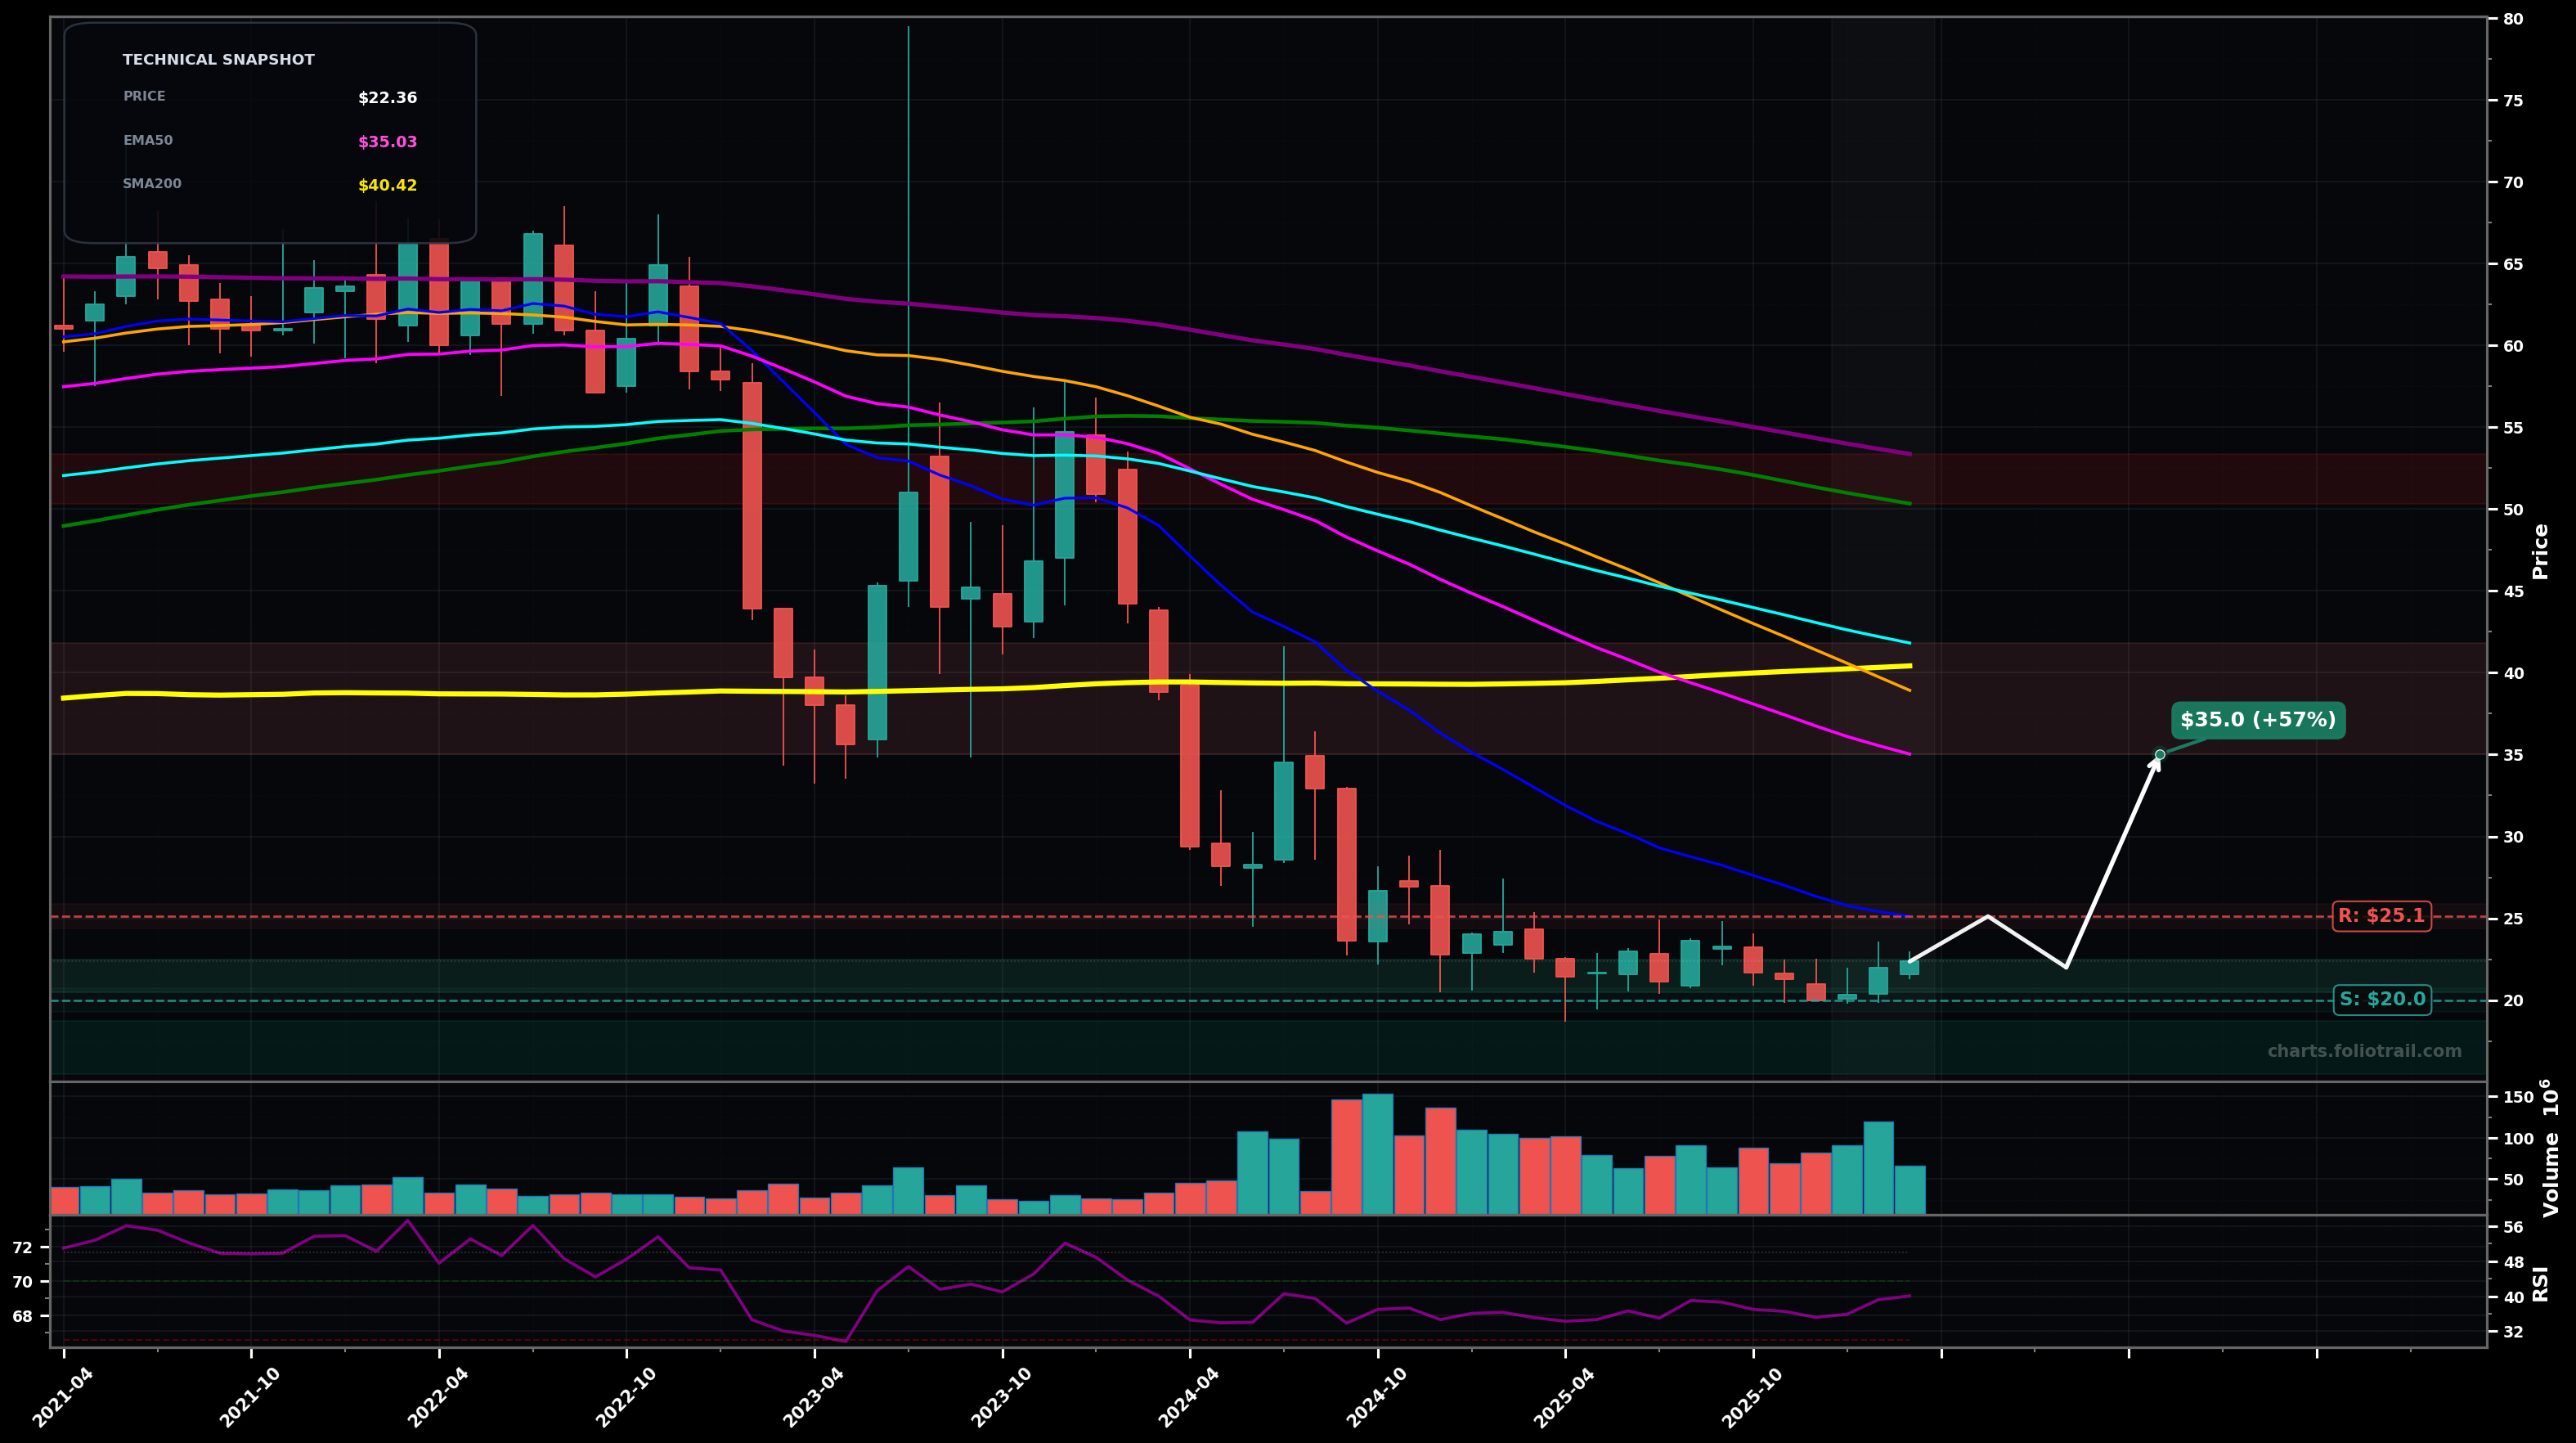
As of March 25, 2026, SIRI (Sirius XM Holdings Inc.) is in a bottoming attempt state on the monthly chart, with a confidence level of 62%. Key support is at $20.0 and key resistance at $25.1. Monthly downtrend has transitioned into a low-volatility base around $20–$24; last candles show small-bodied drift up with RSI ~40 while price remains well below all key MAs.
Base holds; price grinds up into first moving-average resistance (EMA20) and, if reclaimed, mean-reverts toward the next congestion/MA zone.
Support breaks; monthly close under the base triggers a continuation move (Elliott: potential Wave 5 extension after a shallow Wave 4 base).
2+ monthly closes above $25.12 (EMA20) would confirm a more durable reversal attempt
Monthly close below $20.00 would invalidate the bottoming attempt and re-open a continuation leg down
Start near the established base floor; add on a controlled undercut/retest; heavy add only if a deeper capitulation leg prints into prior-extension territory (risk-managed).
Trim into major MA supply zones (EMA50 then EMA100/SMA100) where prior bear-trend rallies often fail; fully close into the heavier long-term overhead (EMA200 region).
As of March 25, 2026, SIRI (Sirius XM Holdings Inc.) is in a bottoming attempt state on the monthly chart with 62% confidence. Monthly downtrend has transitioned into a low-volatility base around $20–$24; last candles show small-bodied drift up with RSI ~40 while price remains well below all key MAs.
On the monthly timeframe, SIRI has key support at $20.0 and key resistance at $25.1. The most likely scenario (bullish) targets $25.1 and $35.0, with a revert level at $22.0.
SIRI (Sirius XM Holdings Inc.) is currently classified as bottoming attempt on the monthly chart, with 62% confidence. Confirmation requires: 2+ monthly closes above $25.12 (EMA20) would confirm a more durable reversal attempt This would be invalidated by: Monthly close below $20.00 would invalidate the bottoming attempt and re-open a continuation leg down
The most likely scenario (bullish) targets $25.1 and $35.0, with a revert level at $22.0. The alternative scenario (bearish) targets $18.0 and $15.0.
Multi-layer AI agents analyse 200+ stocks across daily, weekly, and monthly timeframes — producing market state classifications, price scenarios with targets, and position entry/exit levels. Updated every trading day after market close. No paywall. No sign-up required.
Built by Foliotrail.
All content on this website — including charts, analysis, price targets, support/resistance levels, and position zones — is generated entirely by AI and provided for educational and informational purposes only.
This is not financial advice. NEXUSNOIR VENTURES SL (the operator of this website) is not a registered investment adviser or broker-dealer. You should not make investment decisions based solely on this information. Always do your own research and consult a qualified financial advisor.
By continuing, you acknowledge that you have read and agree to our full disclaimer & terms of use and privacy policy.