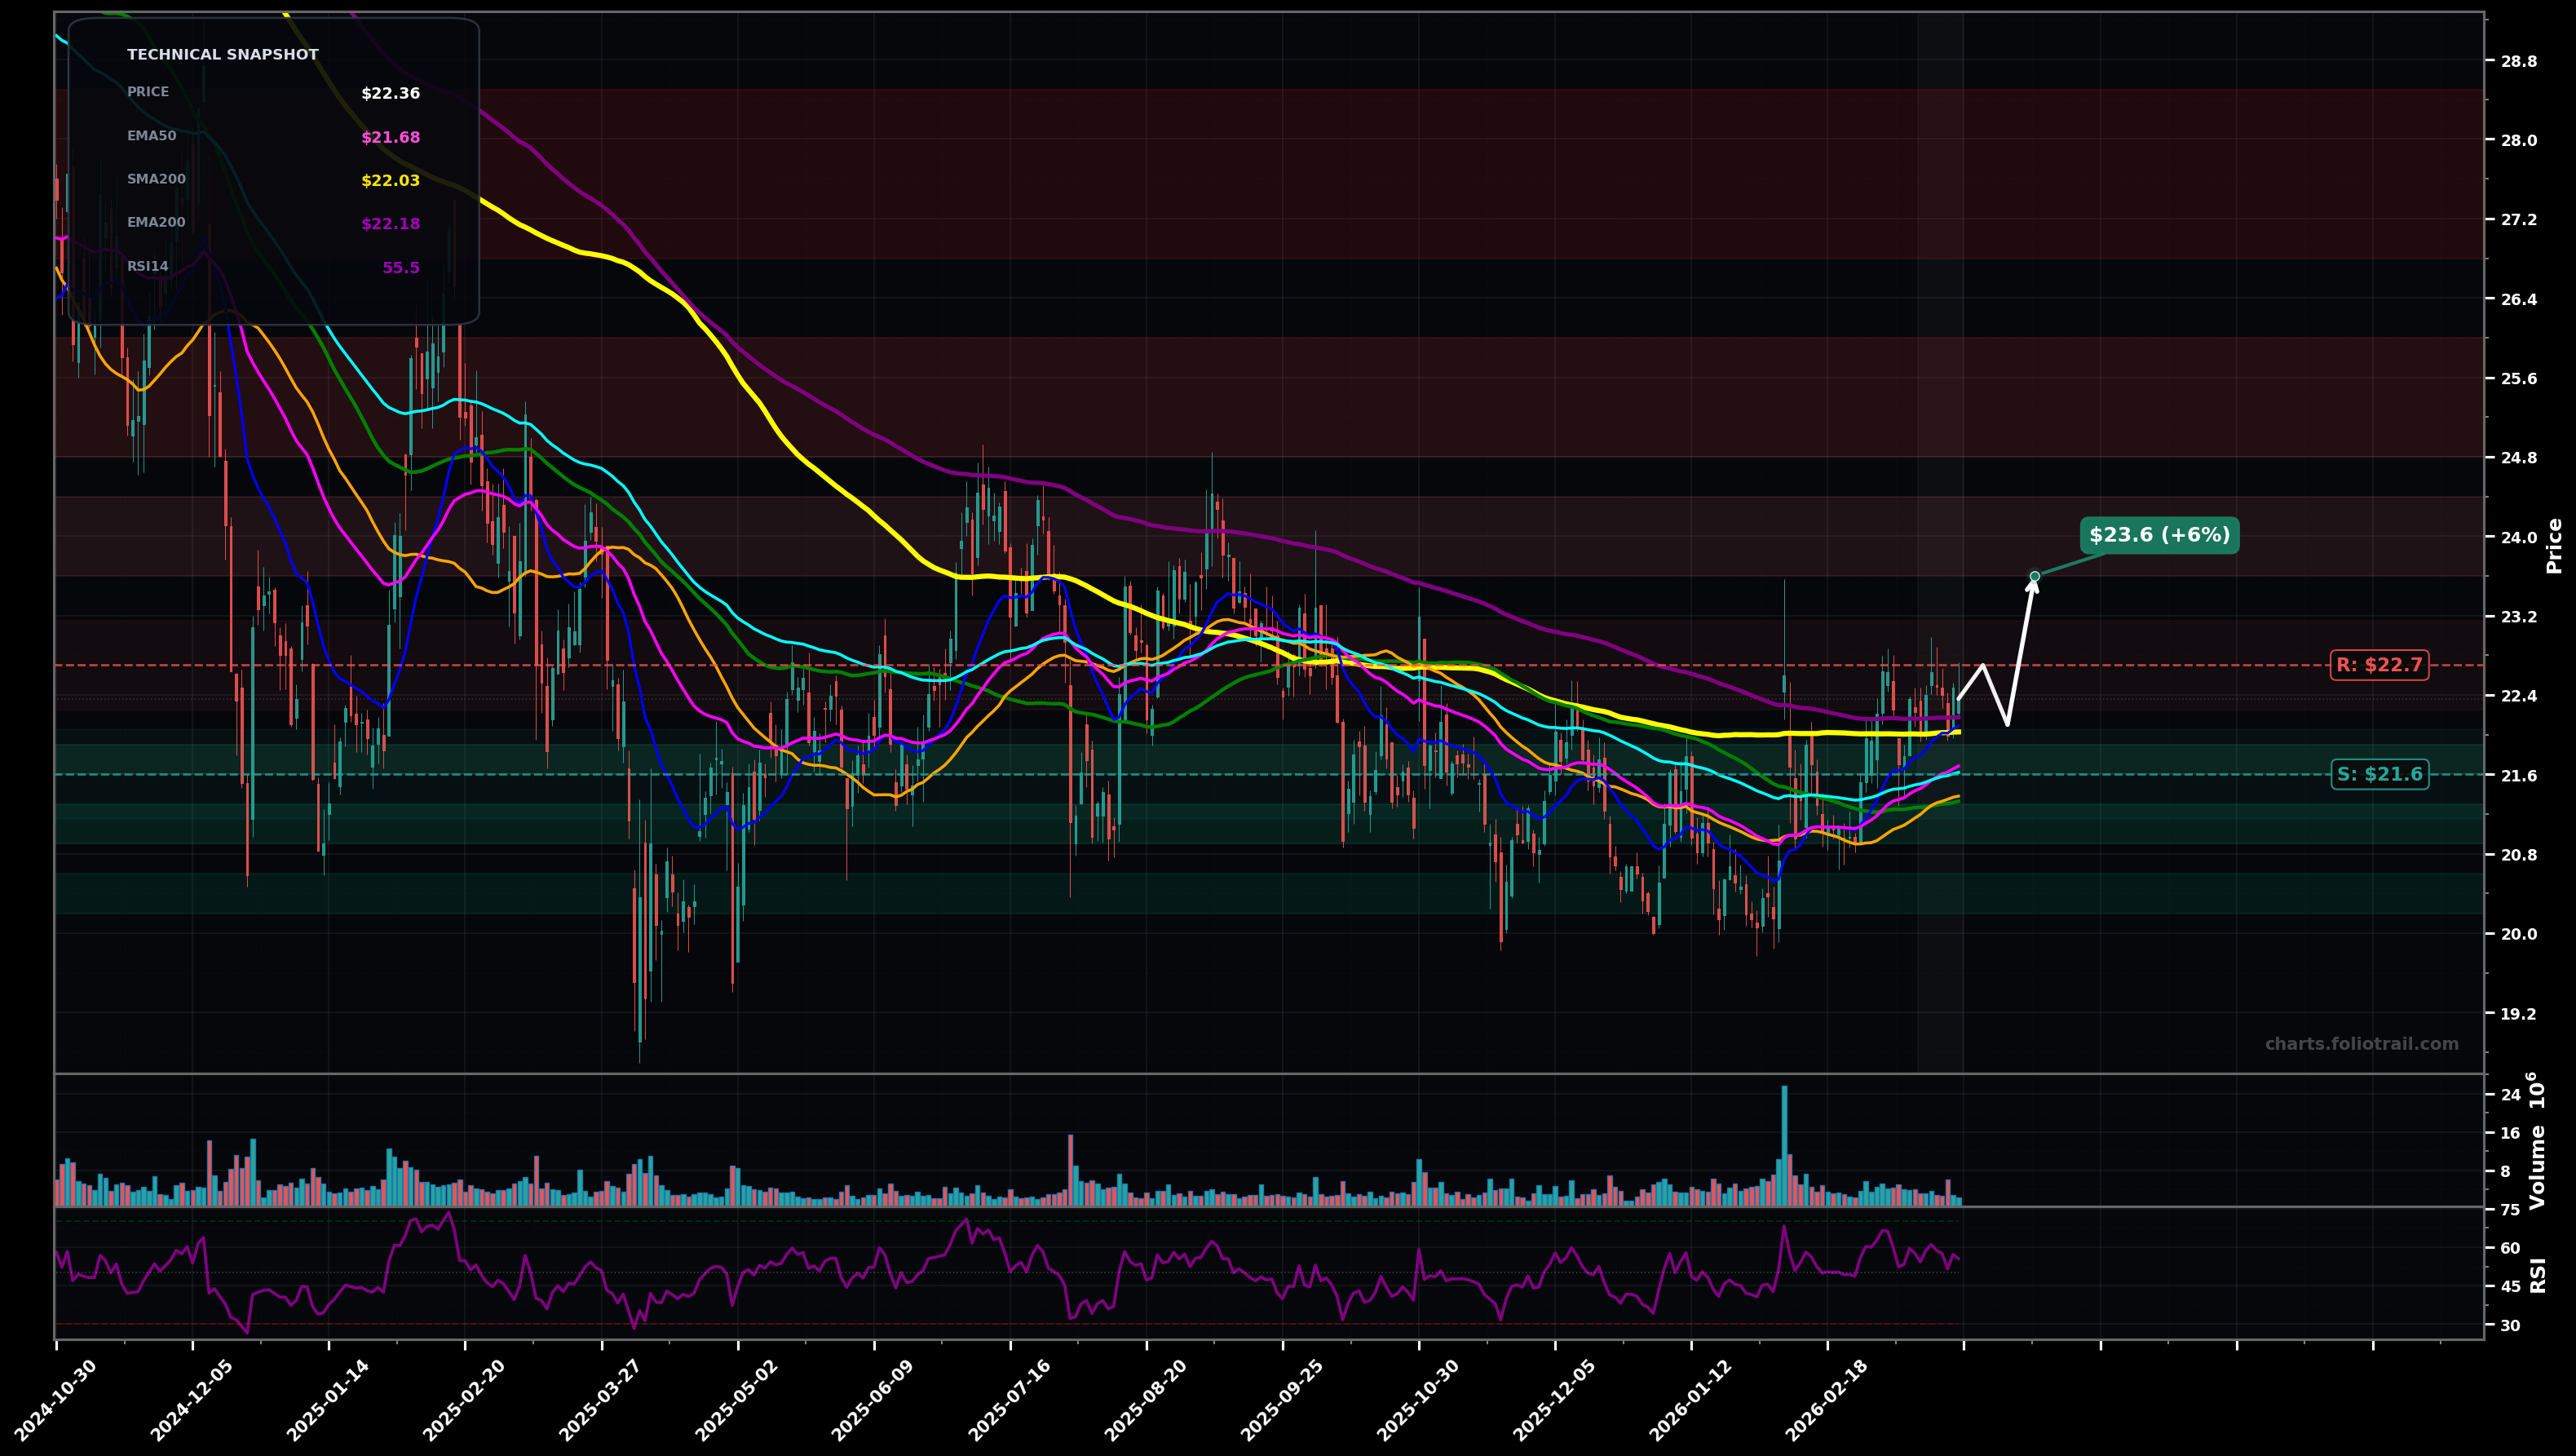
As of March 25, 2026, SIRI (Sirius XM Holdings Inc.) is in a choppy range state on the daily chart, with a confidence level of 64%. Key support is at $21.6 and key resistance at $22.7. Price ~$22.36 is trying to push above clustered short/mid MAs (EMA50/EMA100/SMA50/SMA100) while the long-term MAs (EMA200/SMA200) still hover overhead; RSI ~55 suggests mild momentum but not a trend breakout yet.
Range continuation with a mild bullish bias: price holds above ~$21.60, grinds through the MA cluster, and tests the prior supply band near the long-term averages; Elliott view: this looks like a base-building corrective structure (ABC/triangle) nearing a potential resolution up.
Failure at resistance and rotation back down: rejection near ~$22.70-$23.00 leads to another swing lower inside the range, with risk of a breakdown if $21.60 gives way; Elliott view: sideways-to-down corrective leg resumes (C/3 of a smaller degree).
2+ daily closes above $22.70 followed by a hold/retest that stays above $22.40
Daily close below $21.60 (range breakdown with loss of MA cluster)
Scale-in around the current swing-low support ($21.6) and deeper range support ($20.6) while invalidating on a decisive breakdown; this aligns with mean-reversion inside a chop/base.
Trim into overhead supply/long-term MA zone first, then more aggressively if price becomes stretched above the multi-month range and approaches prior distribution areas (mean-reversion risk rises).
As of March 25, 2026, SIRI (Sirius XM Holdings Inc.) is in a choppy range state on the daily chart with 64% confidence. Price ~$22.36 is trying to push above clustered short/mid MAs (EMA50/EMA100/SMA50/SMA100) while the long-term MAs (EMA200/SMA200) still hover overhead; RSI ~55 suggests mild momentum but not a trend breakout yet.
On the daily timeframe, SIRI has key support at $21.6 and key resistance at $22.7. The most likely scenario (bullish) targets $22.7 and $23.6, with a revert level at $22.1.
SIRI (Sirius XM Holdings Inc.) is currently classified as choppy range on the daily chart, with 64% confidence. Confirmation requires: 2+ daily closes above $22.70 followed by a hold/retest that stays above $22.40 This would be invalidated by: Daily close below $21.60 (range breakdown with loss of MA cluster)
The most likely scenario (bullish) targets $22.7 and $23.6, with a revert level at $22.1. The alternative scenario (bearish) targets $21.6 and $20.6.
Multi-layer AI agents analyse 200+ stocks across daily, weekly, and monthly timeframes — producing market state classifications, price scenarios with targets, and position entry/exit levels. Updated every trading day after market close. No paywall. No sign-up required.
Built by Foliotrail.
All content on this website — including charts, analysis, price targets, support/resistance levels, and position zones — is generated entirely by AI and provided for educational and informational purposes only.
This is not financial advice. NEXUSNOIR VENTURES SL (the operator of this website) is not a registered investment adviser or broker-dealer. You should not make investment decisions based solely on this information. Always do your own research and consult a qualified financial advisor.
By continuing, you acknowledge that you have read and agree to our full disclaimer & terms of use and privacy policy.