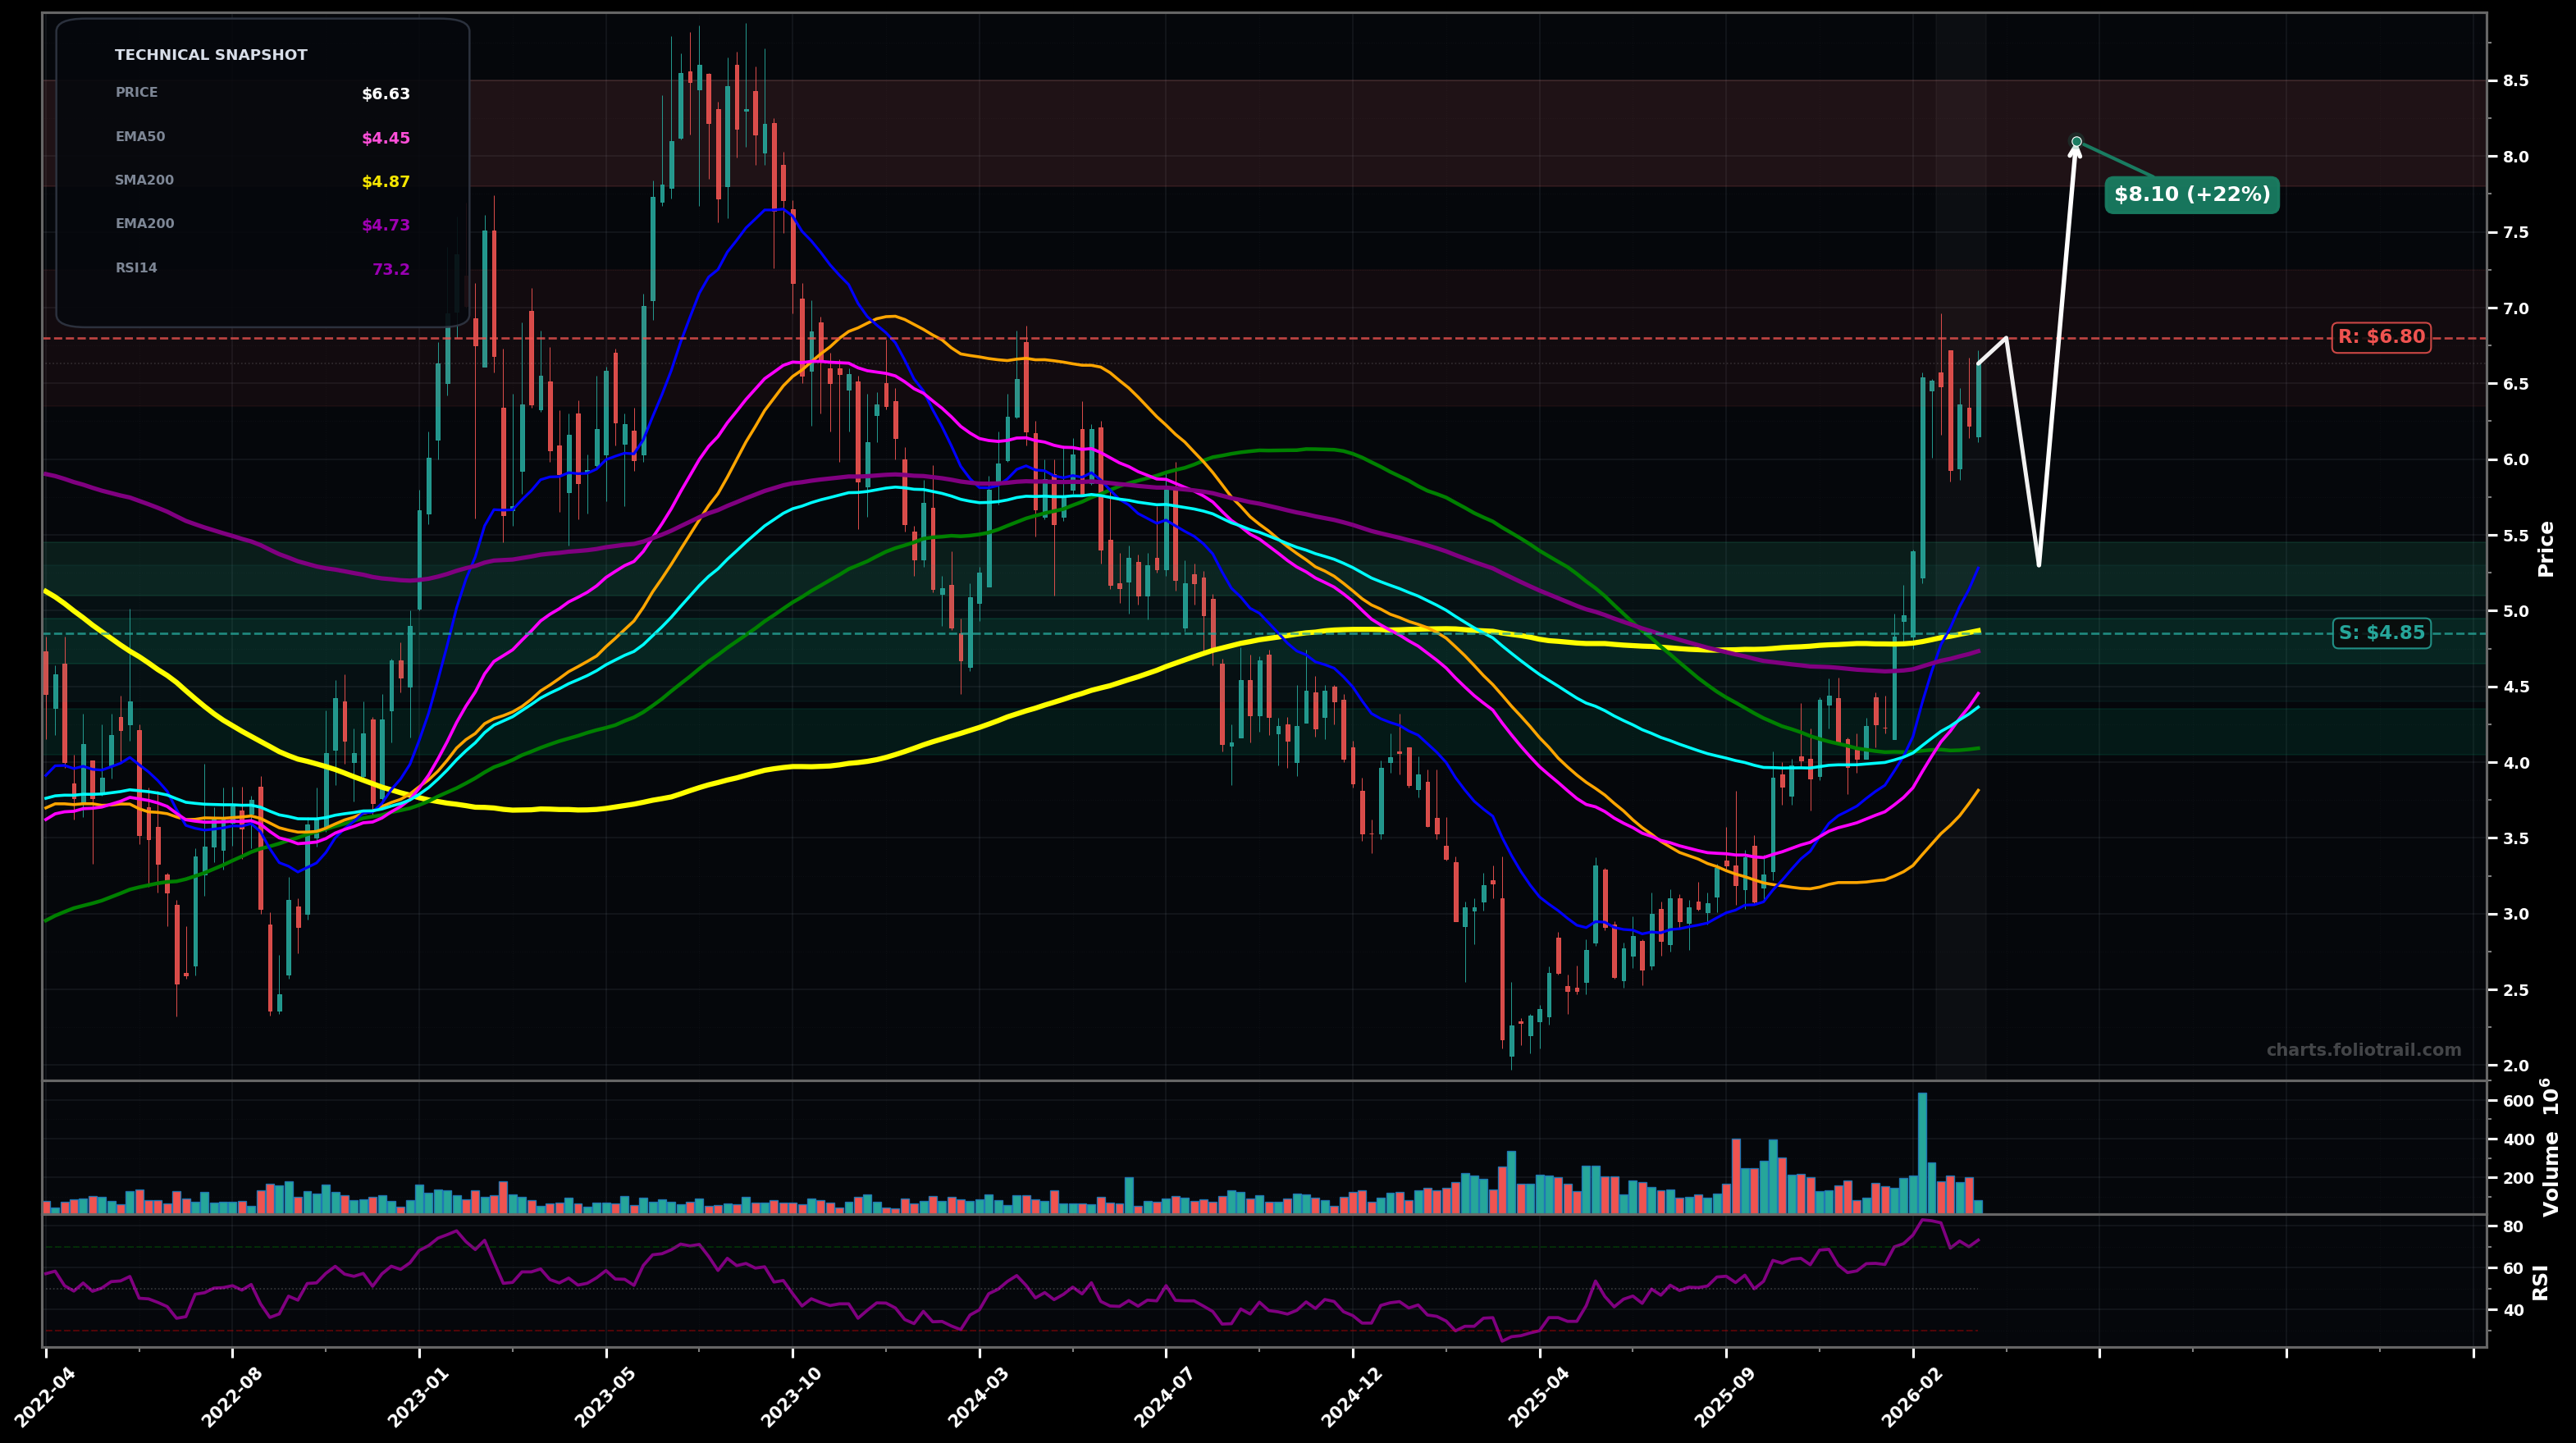
As of March 25, 2026, RIG (Transocean Ltd.) is in a breakout reversal state on the weekly chart, with a confidence level of 72%. Key support is at $4.85 and key resistance at $6.80. Strong impulse up from the $2s, reclaiming major MAs (SMA/EMA 200 cluster) and pausing near $6.6 with RSI-14 ~73 (extended).
Bullish continuation after a controlled pullback/retest of the reclaimed $5.0 area (MA cluster) then push to the next supply zone; Elliott Wave view: likely Wave (3) in progress with a near-term Wave (4) pullback before another leg up.
Failed breakout: momentum fades from overbought conditions, price loses the $5.0–$4.7 long-term MA reclaim and mean-reverts deeper into the prior base (bearish ABC correction).
Weekly close > $6.80 with another close holding above $6.20
Weekly close < $4.70 (loss of EMA200/SMA200 reclaim)
Prefer buying pullbacks into the reclaimed EMA200/SMA200 area ($4.7–$4.9) and prior breakout shelf ($5.1–$5.4); heavy add only if a deeper fib-style retrace returns to the prior consolidation near ~$4.1.
Trim into prior weekly supply/extension zones: first near the 2023 pivot region (~$8), then into larger multi-year resistance (~$10–$11); fully exit only if price reaches a clear multi-year euphoric extension (~$12.5+), likely far above rising MAs.
As of March 25, 2026, RIG (Transocean Ltd.) is in a breakout reversal state on the weekly chart with 72% confidence. Strong impulse up from the $2s, reclaiming major MAs (SMA/EMA 200 cluster) and pausing near $6.6 with RSI-14 ~73 (extended).
On the weekly timeframe, RIG has key support at $4.85 and key resistance at $6.80. The most likely scenario (bullish) targets $6.80 and $8.10, with a revert level at $5.30.
RIG (Transocean Ltd.) is currently classified as breakout reversal on the weekly chart, with 72% confidence. Confirmation requires: Weekly close > $6.80 with another close holding above $6.20 This would be invalidated by: Weekly close < $4.70 (loss of EMA200/SMA200 reclaim)
The most likely scenario (bullish) targets $6.80 and $8.10, with a revert level at $5.30. The alternative scenario (bearish) targets $4.70 and $4.10.
Multi-layer AI agents analyse 200+ stocks across daily, weekly, and monthly timeframes — producing market state classifications, price scenarios with targets, and position entry/exit levels. Updated every trading day after market close. No paywall. No sign-up required.
Built by Foliotrail.
All content on this website — including charts, analysis, price targets, support/resistance levels, and position zones — is generated entirely by AI and provided for educational and informational purposes only.
This is not financial advice. NEXUSNOIR VENTURES SL (the operator of this website) is not a registered investment adviser or broker-dealer. You should not make investment decisions based solely on this information. Always do your own research and consult a qualified financial advisor.
By continuing, you acknowledge that you have read and agree to our full disclaimer & terms of use and privacy policy.