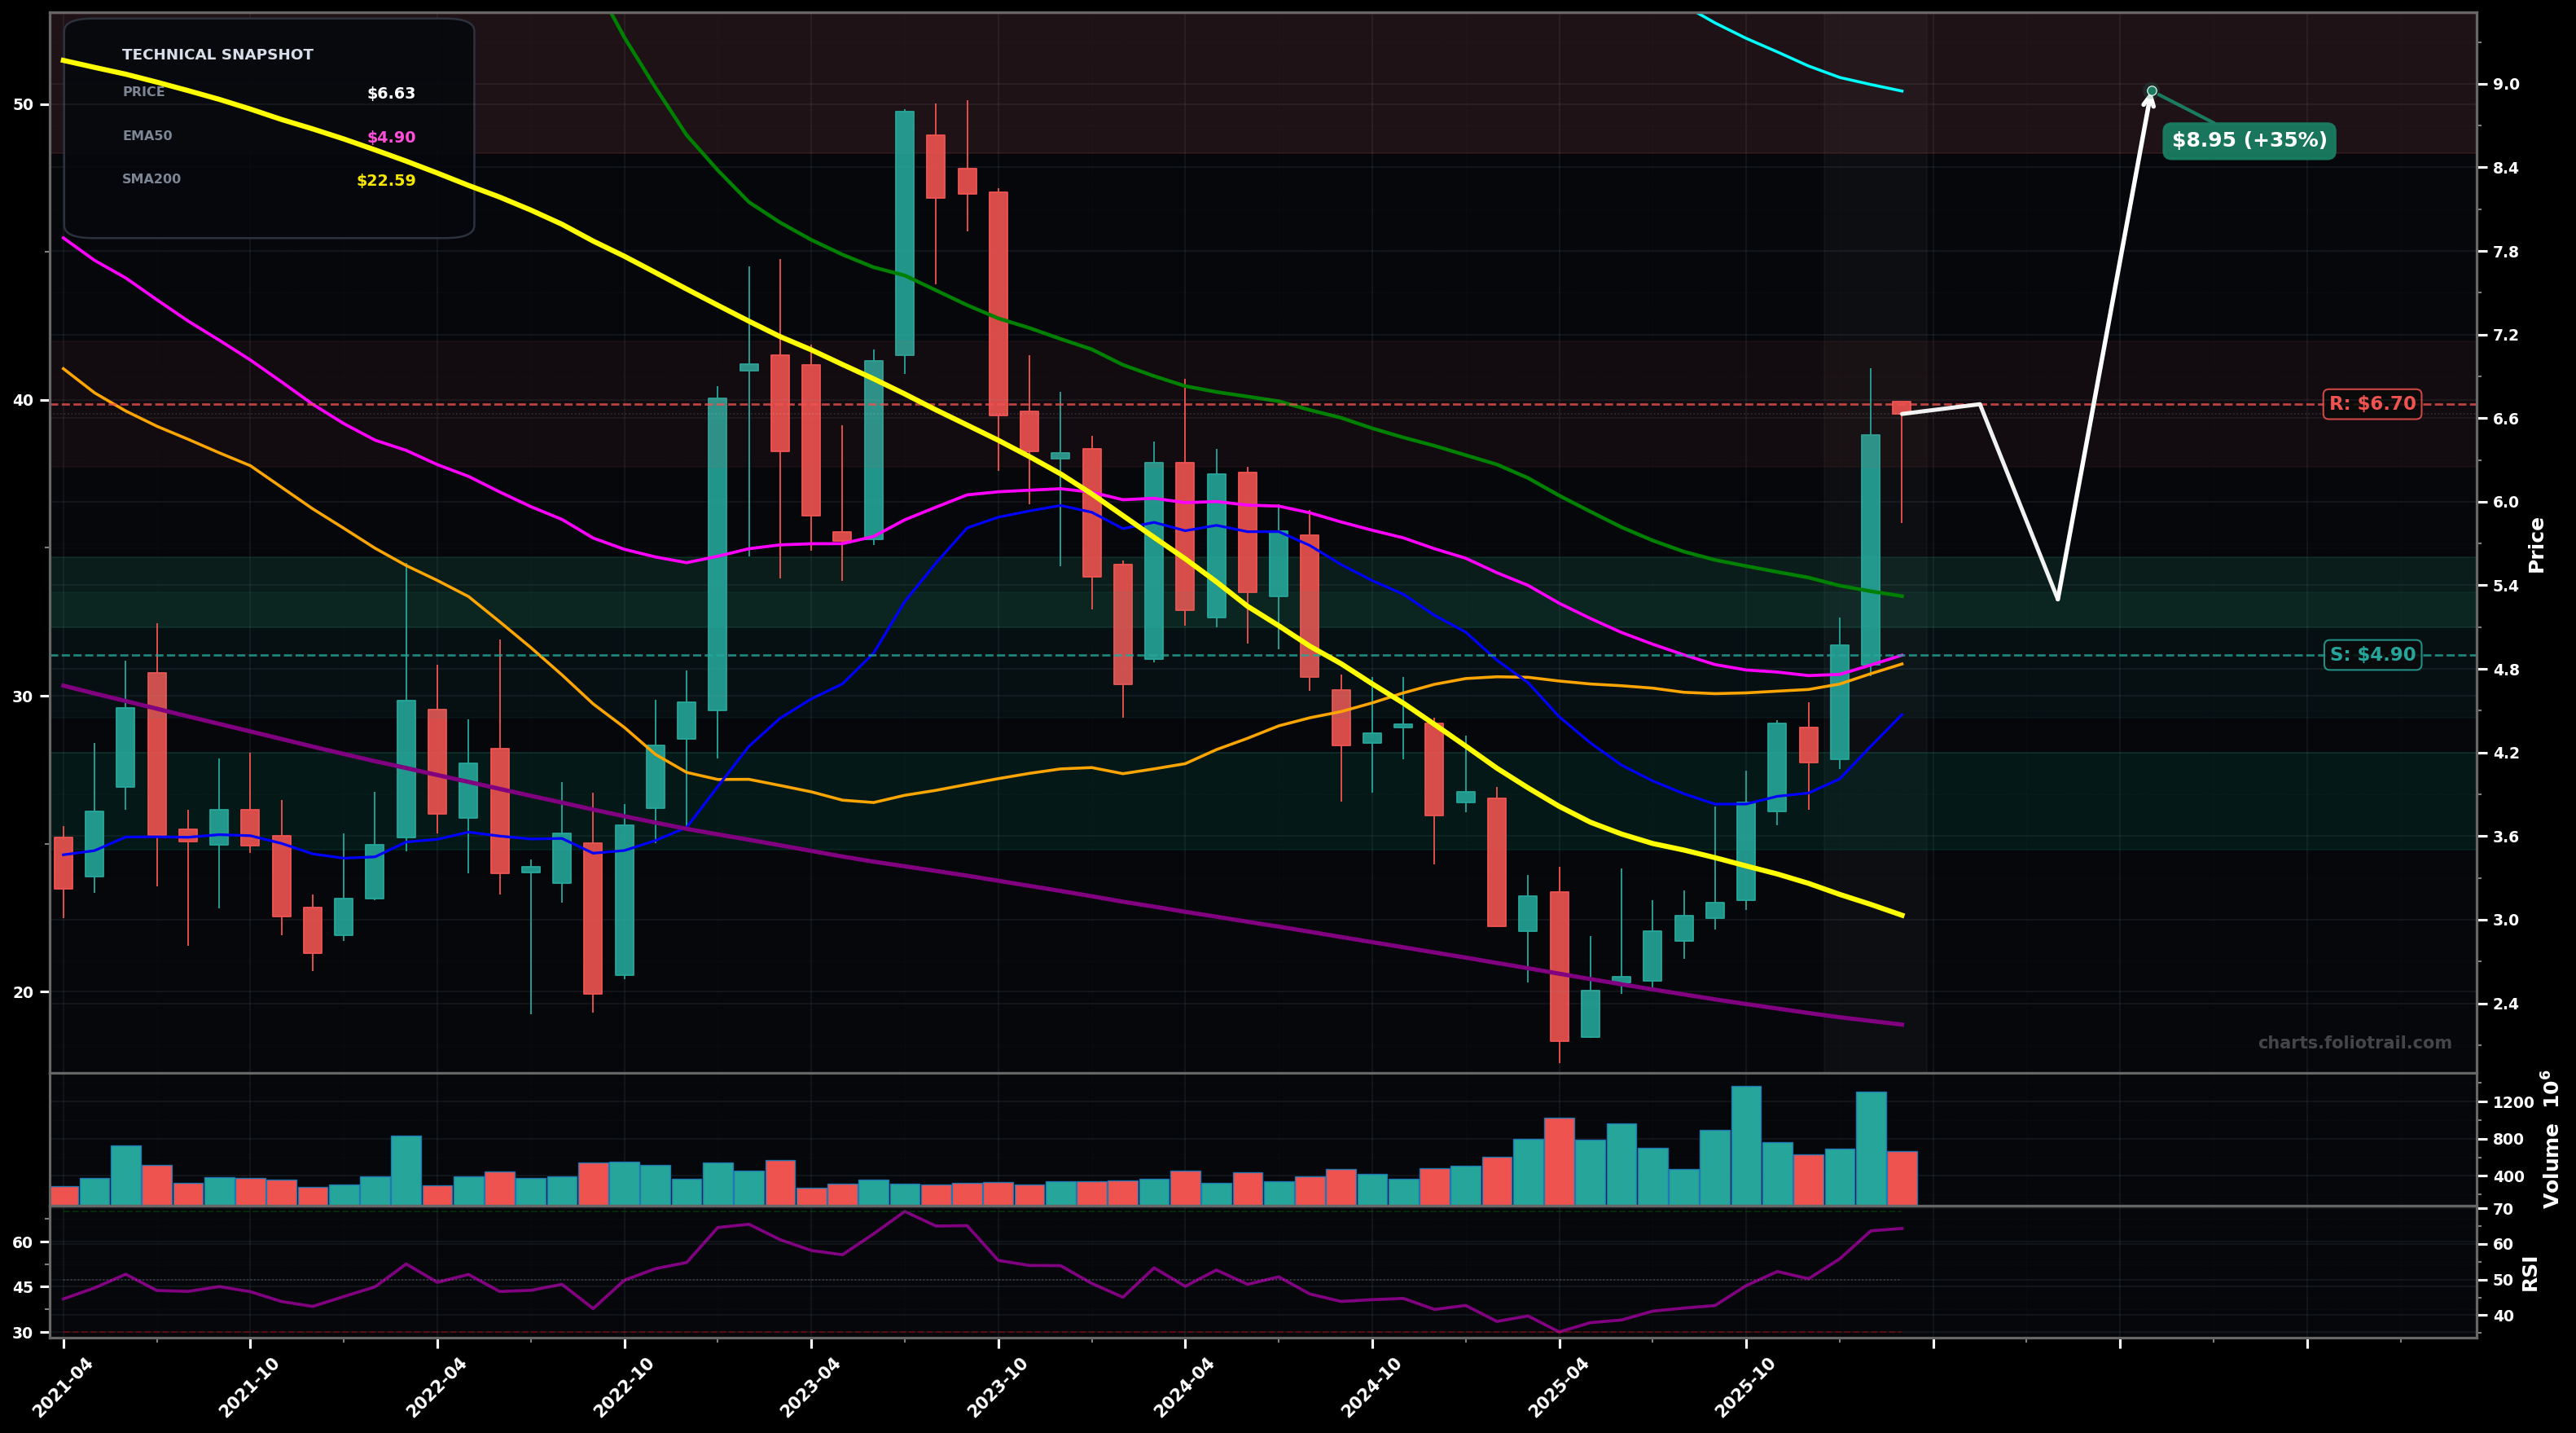
As of March 25, 2026, RIG (Transocean Ltd.) is in a breakout reversal state on the monthly chart, with a confidence level of 62%. Key support is at $4.90 and key resistance at $6.70. Monthly rebound from early-2025 swing low with strong green candles; price reclaimed the $5 area and is pressing into clustered moving-average resistance near $6–$7; RSI rising (~64).
Bullish continuation: breakout holds above the $6.7 area, followed by a measured push into the next supply band near $8–$9; expect at least one pullback retest into the $5s before attempting the higher target.
Rejection at MA/overhead supply: price fails near $6.7–$7 and mean-reverts to the reclaimed MAs; if $4.9 fails on a close, downside reopens toward the prior base/early-2025 lows.
Monthly close above $6.70 with next month holding above $6.70
Monthly close back below $4.90
Start on controlled pullback above reclaimed EMA50/SMA50; add on deeper retest of the breakout/base; heavy add only near prior demand zone if the breakout fails but structure remains recoverable.
Trim into major overhead supply/likely Fibonacci extension zones (prior swing distribution areas); increase trimming as price gets extended away from rising EMA50 and into multi-year resistance bands.
As of March 25, 2026, RIG (Transocean Ltd.) is in a breakout reversal state on the monthly chart with 62% confidence. Monthly rebound from early-2025 swing low with strong green candles; price reclaimed the $5 area and is pressing into clustered moving-average resistance near $6–$7; RSI rising (~64).
On the monthly timeframe, RIG has key support at $4.90 and key resistance at $6.70. The most likely scenario (bullish) targets $6.70 and $8.95, with a revert level at $5.30.
RIG (Transocean Ltd.) is currently classified as breakout reversal on the monthly chart, with 62% confidence. Confirmation requires: Monthly close above $6.70 with next month holding above $6.70 This would be invalidated by: Monthly close back below $4.90
The most likely scenario (bullish) targets $6.70 and $8.95, with a revert level at $5.30. The alternative scenario (bearish) targets $4.90 and $3.50.
Multi-layer AI agents analyse 200+ stocks across daily, weekly, and monthly timeframes — producing market state classifications, price scenarios with targets, and position entry/exit levels. Updated every trading day after market close. No paywall. No sign-up required.
Built by Foliotrail.
All content on this website — including charts, analysis, price targets, support/resistance levels, and position zones — is generated entirely by AI and provided for educational and informational purposes only.
This is not financial advice. NEXUSNOIR VENTURES SL (the operator of this website) is not a registered investment adviser or broker-dealer. You should not make investment decisions based solely on this information. Always do your own research and consult a qualified financial advisor.
By continuing, you acknowledge that you have read and agree to our full disclaimer & terms of use and privacy policy.