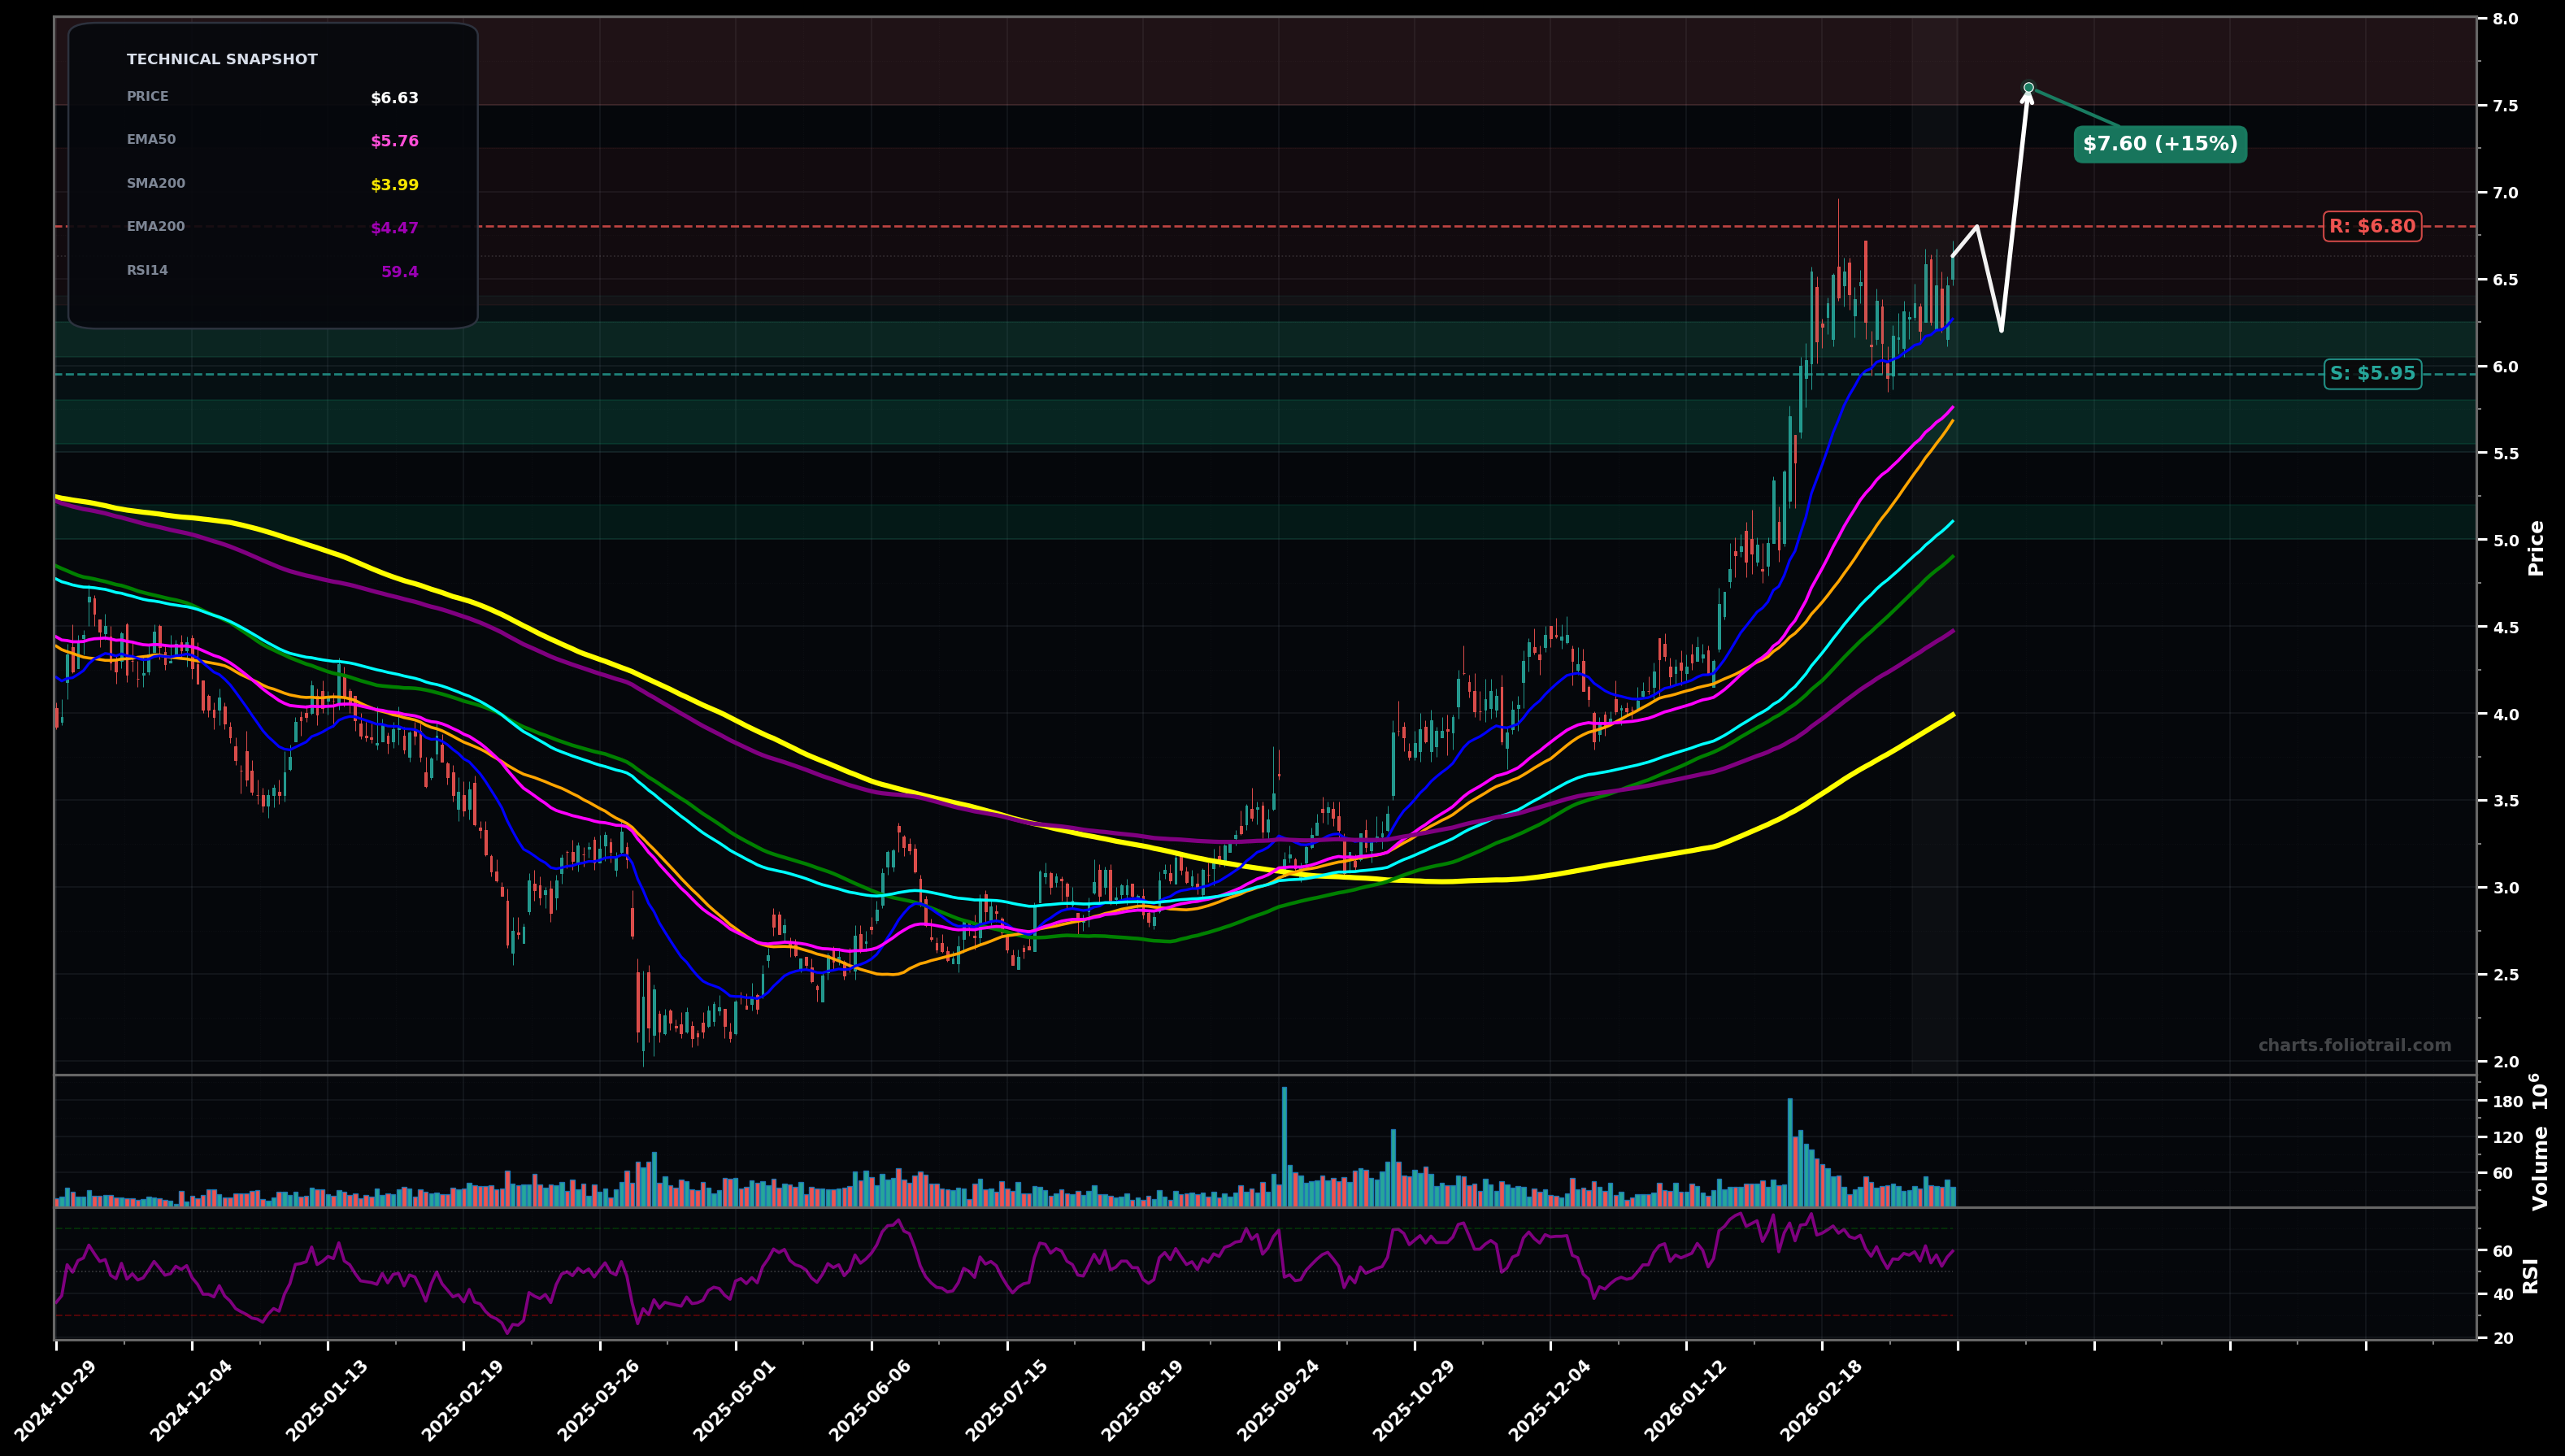
As of March 25, 2026, RIG (Transocean Ltd.) is in a uptrend state on the daily chart, with a confidence level of 72%. Key support is at $5.95 and key resistance at $6.80. After a strong run-up, price is consolidating near highs around $6.3–$6.7 while staying above rising EMA50/EMA100; RSI ~59 (neutral-bullish).
Bullish continuation: tight consolidation resolves upward; trend resumes with price holding above EMA50 and breaking the recent swing high.
Bearish pullback: failed breakout/rolling top leads to a deeper mean reversion toward the rising MA cluster (EMA100/SMA50 area) before buyers reappear.
Daily close above $6.80 with follow-through (next close holds above $6.60).
Daily close below $5.95 (loss of recent consolidation floor / momentum break).
Start on pullback toward prior breakout/short-term base ($6.1–$6.2); add on EMA50/SMA50 confluence; heavy add near EMA100 (~$5.10) where trend support is strongest if structure holds.
Trim into upside extensions (likely Fibonacci/impulse wave extension zones) as distance from EMA50/EMA100 becomes stretched; progressively reduce as price approaches multi-year extension targets.
As of March 25, 2026, RIG (Transocean Ltd.) is in a uptrend state on the daily chart with 72% confidence. After a strong run-up, price is consolidating near highs around $6.3–$6.7 while staying above rising EMA50/EMA100; RSI ~59 (neutral-bullish).
On the daily timeframe, RIG has key support at $5.95 and key resistance at $6.80. The most likely scenario (bullish) targets $6.80 and $7.60, with a revert level at $6.20.
RIG (Transocean Ltd.) is currently classified as uptrend on the daily chart, with 72% confidence. Confirmation requires: Daily close above $6.80 with follow-through (next close holds above $6.60). This would be invalidated by: Daily close below $5.95 (loss of recent consolidation floor / momentum break).
The most likely scenario (bullish) targets $6.80 and $7.60, with a revert level at $6.20. The alternative scenario (bearish) targets $6.20 and $5.10.
Multi-layer AI agents analyse 200+ stocks across daily, weekly, and monthly timeframes — producing market state classifications, price scenarios with targets, and position entry/exit levels. Updated every trading day after market close. No paywall. No sign-up required.
Built by Foliotrail.
All content on this website — including charts, analysis, price targets, support/resistance levels, and position zones — is generated entirely by AI and provided for educational and informational purposes only.
This is not financial advice. NEXUSNOIR VENTURES SL (the operator of this website) is not a registered investment adviser or broker-dealer. You should not make investment decisions based solely on this information. Always do your own research and consult a qualified financial advisor.
By continuing, you acknowledge that you have read and agree to our full disclaimer & terms of use and privacy policy.